Scheelite and Fluorapatite from Pingwu, China
Contributed by: Michael Crawford
Date: Nov 6th, 2025
Locality: Pingwu beryl mine, Huya township, Mount Little Xuebaoding, Pingwu Co., Mianyang, Sichuan, China (See on Mindat)
Size: 6.5 x 11 cm
Description:
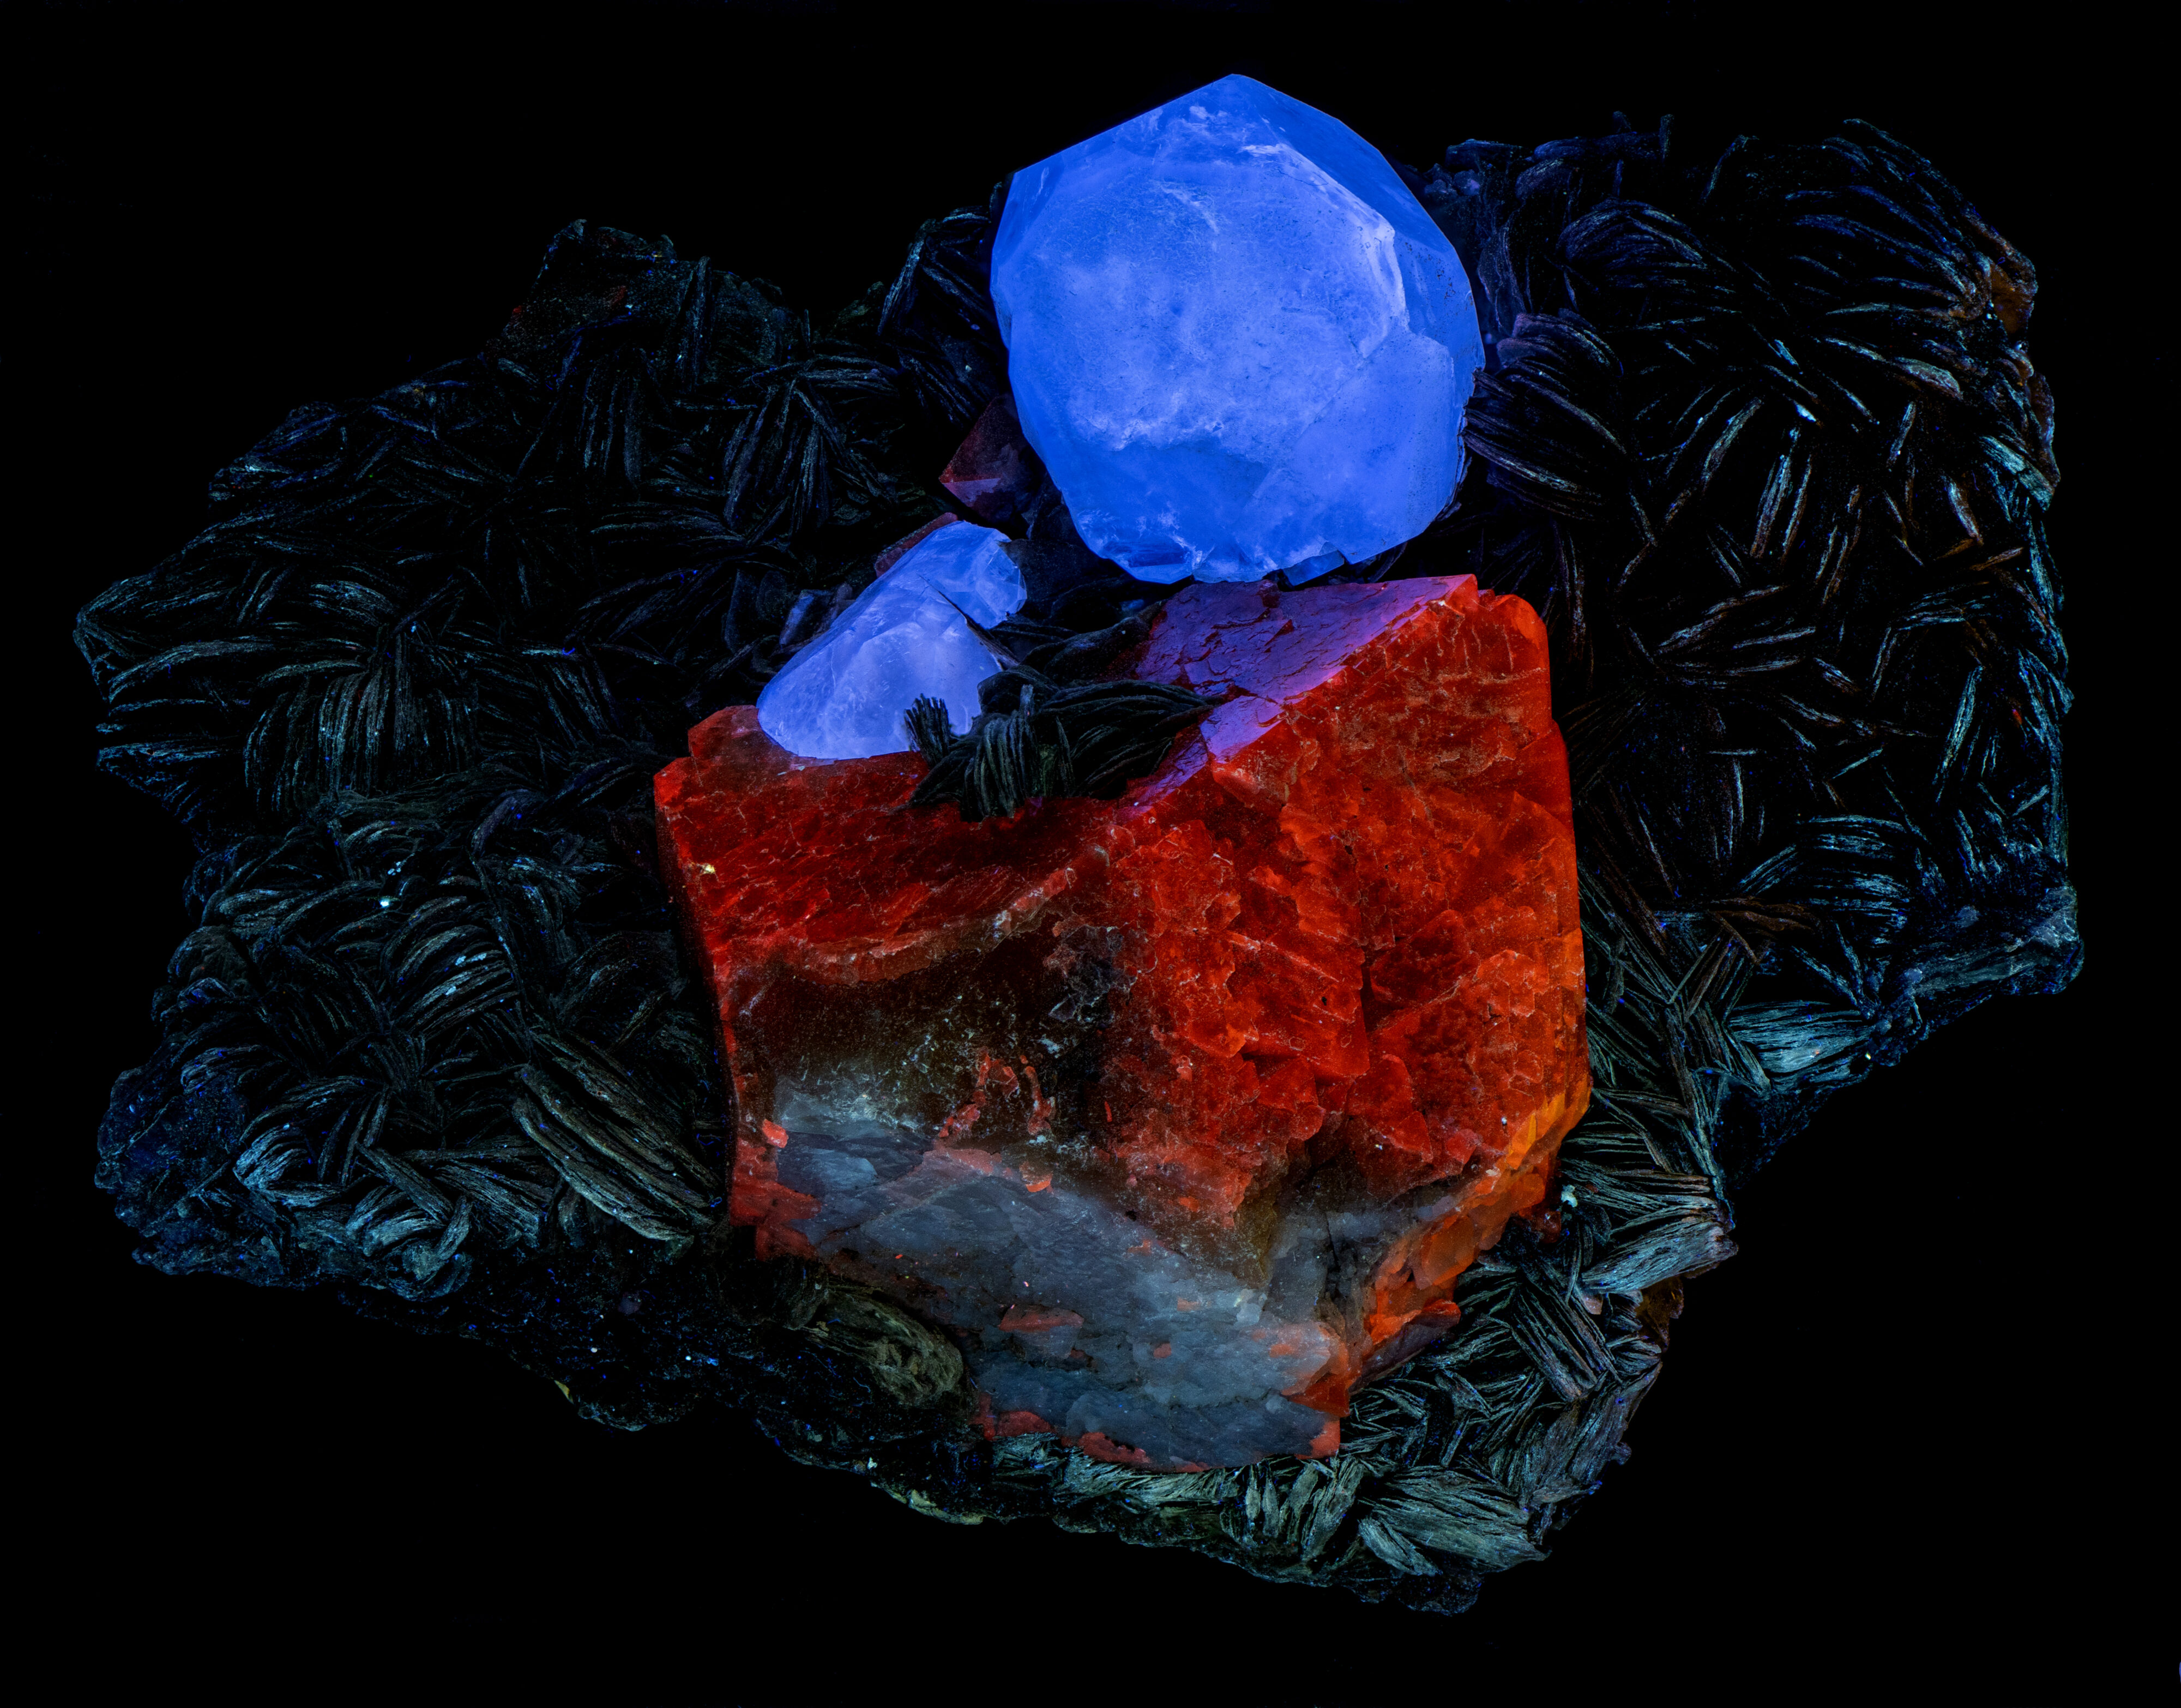
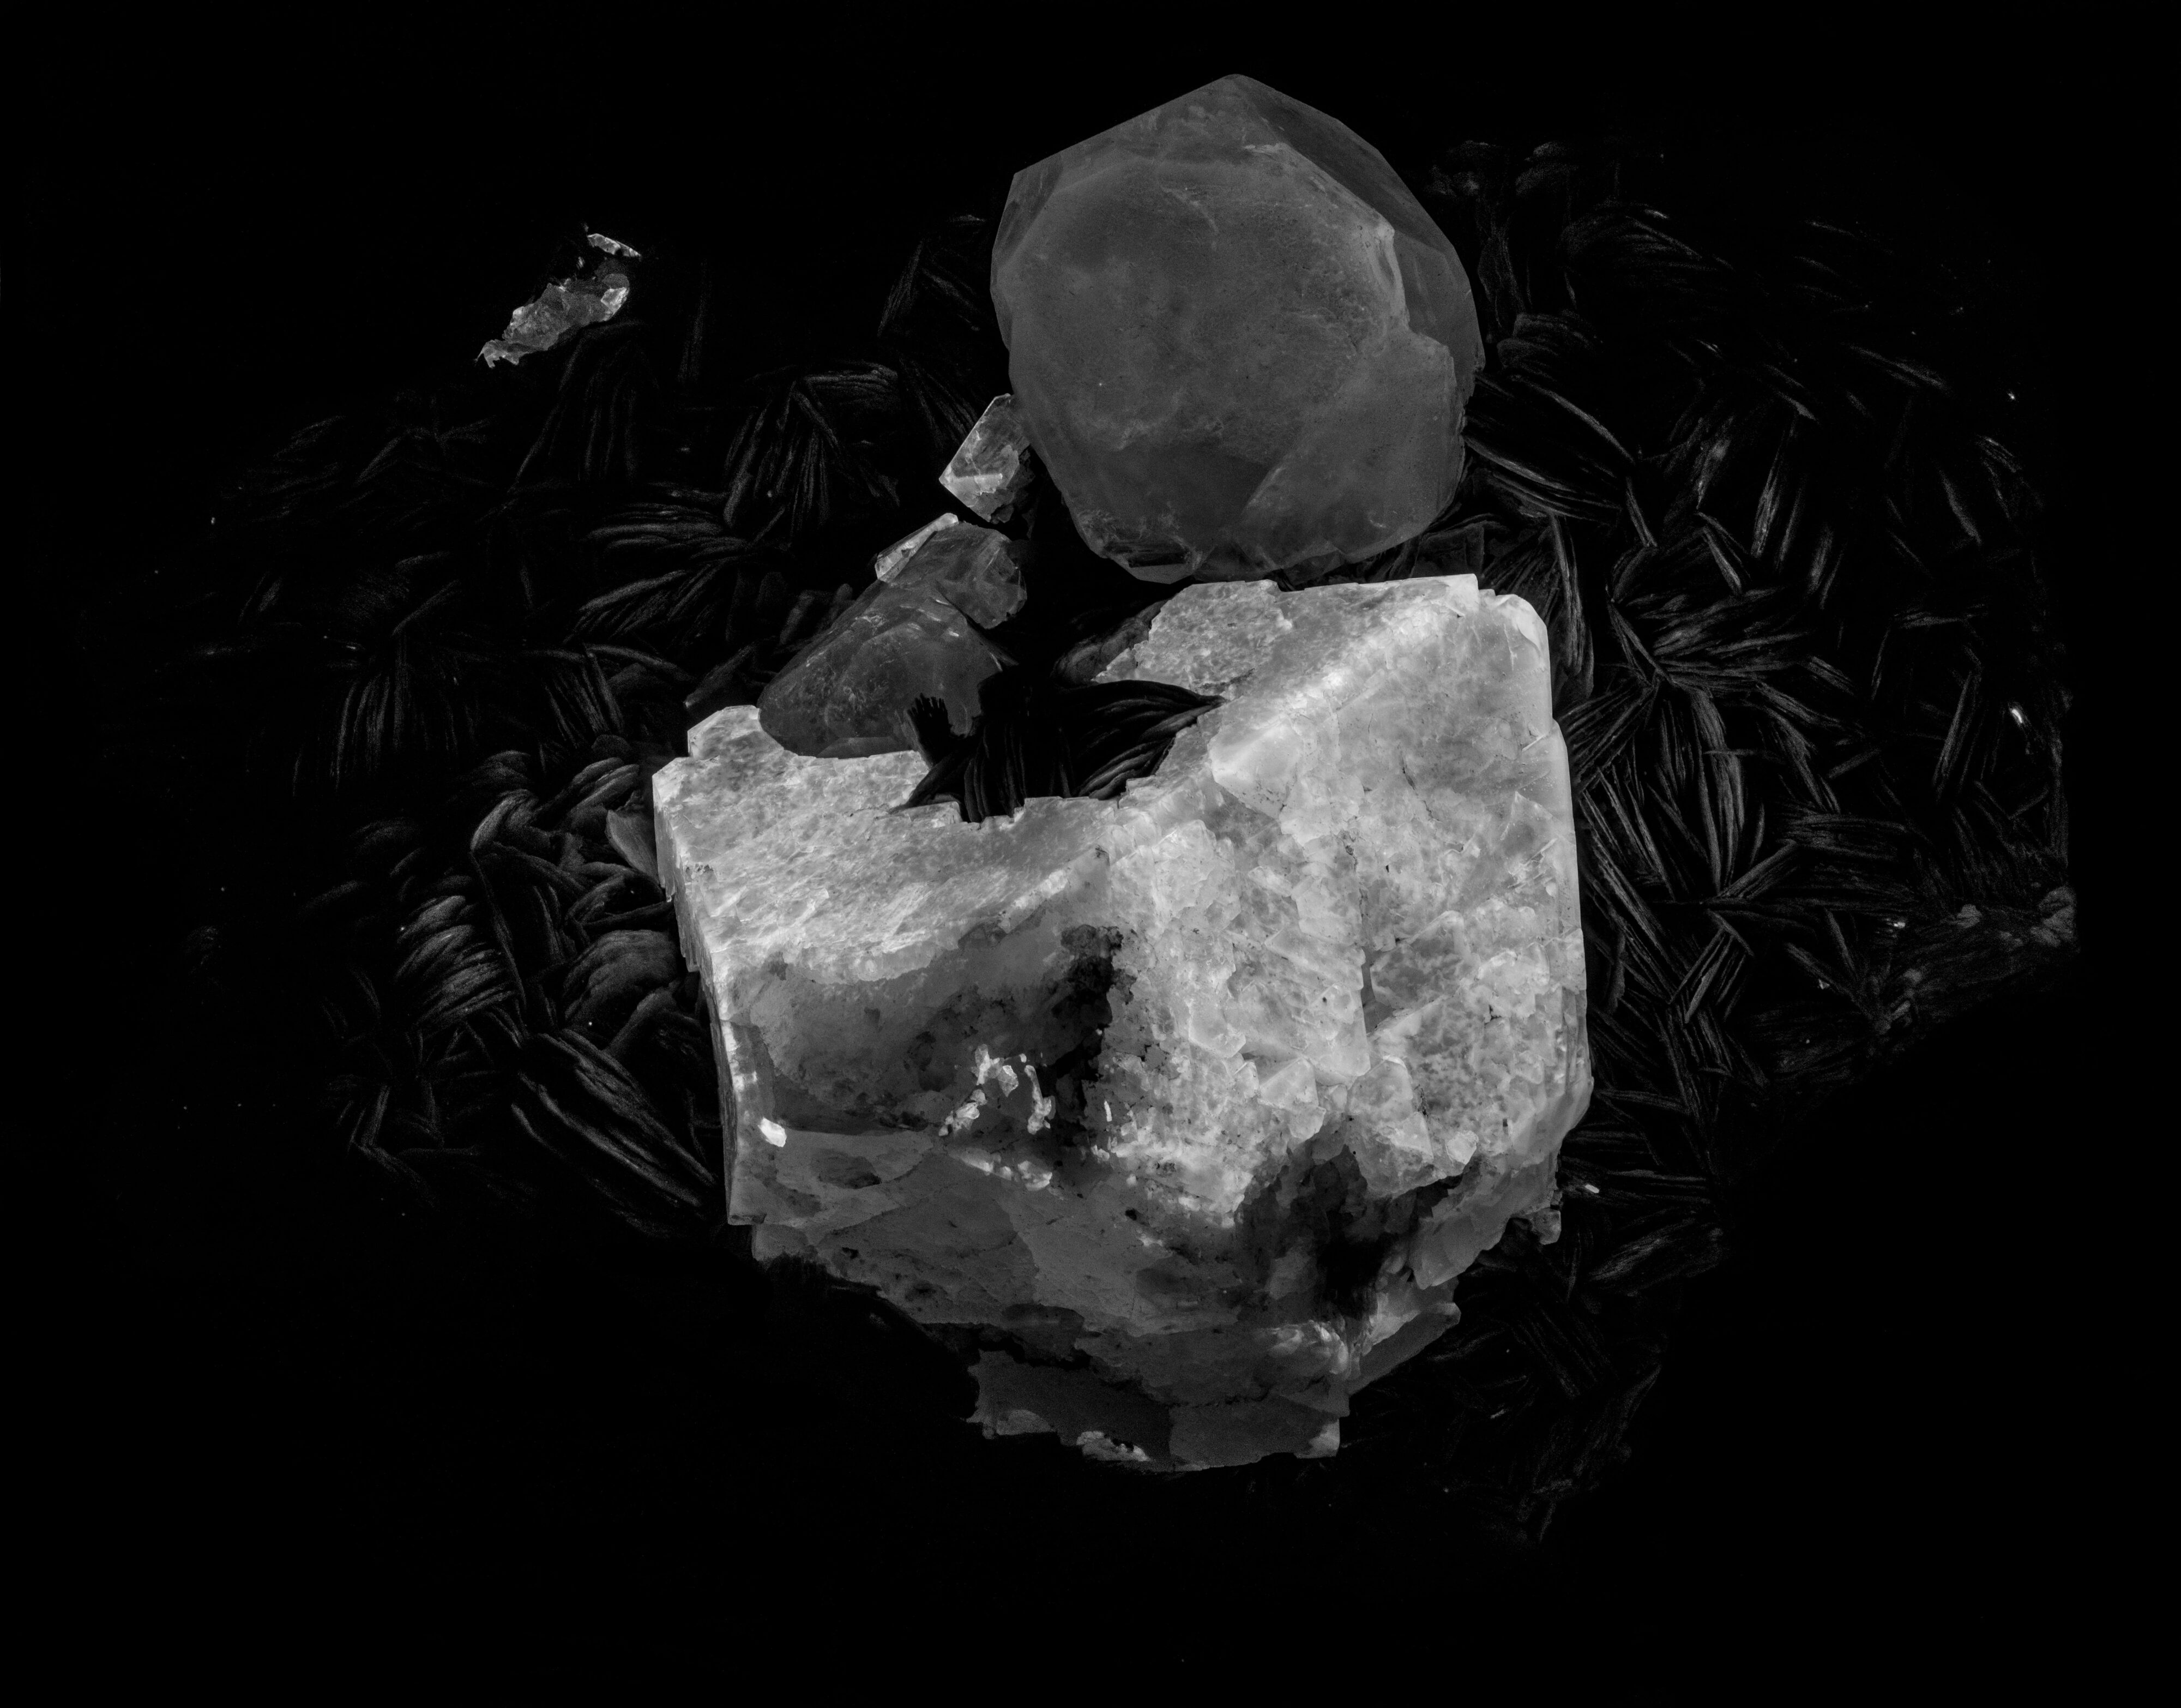
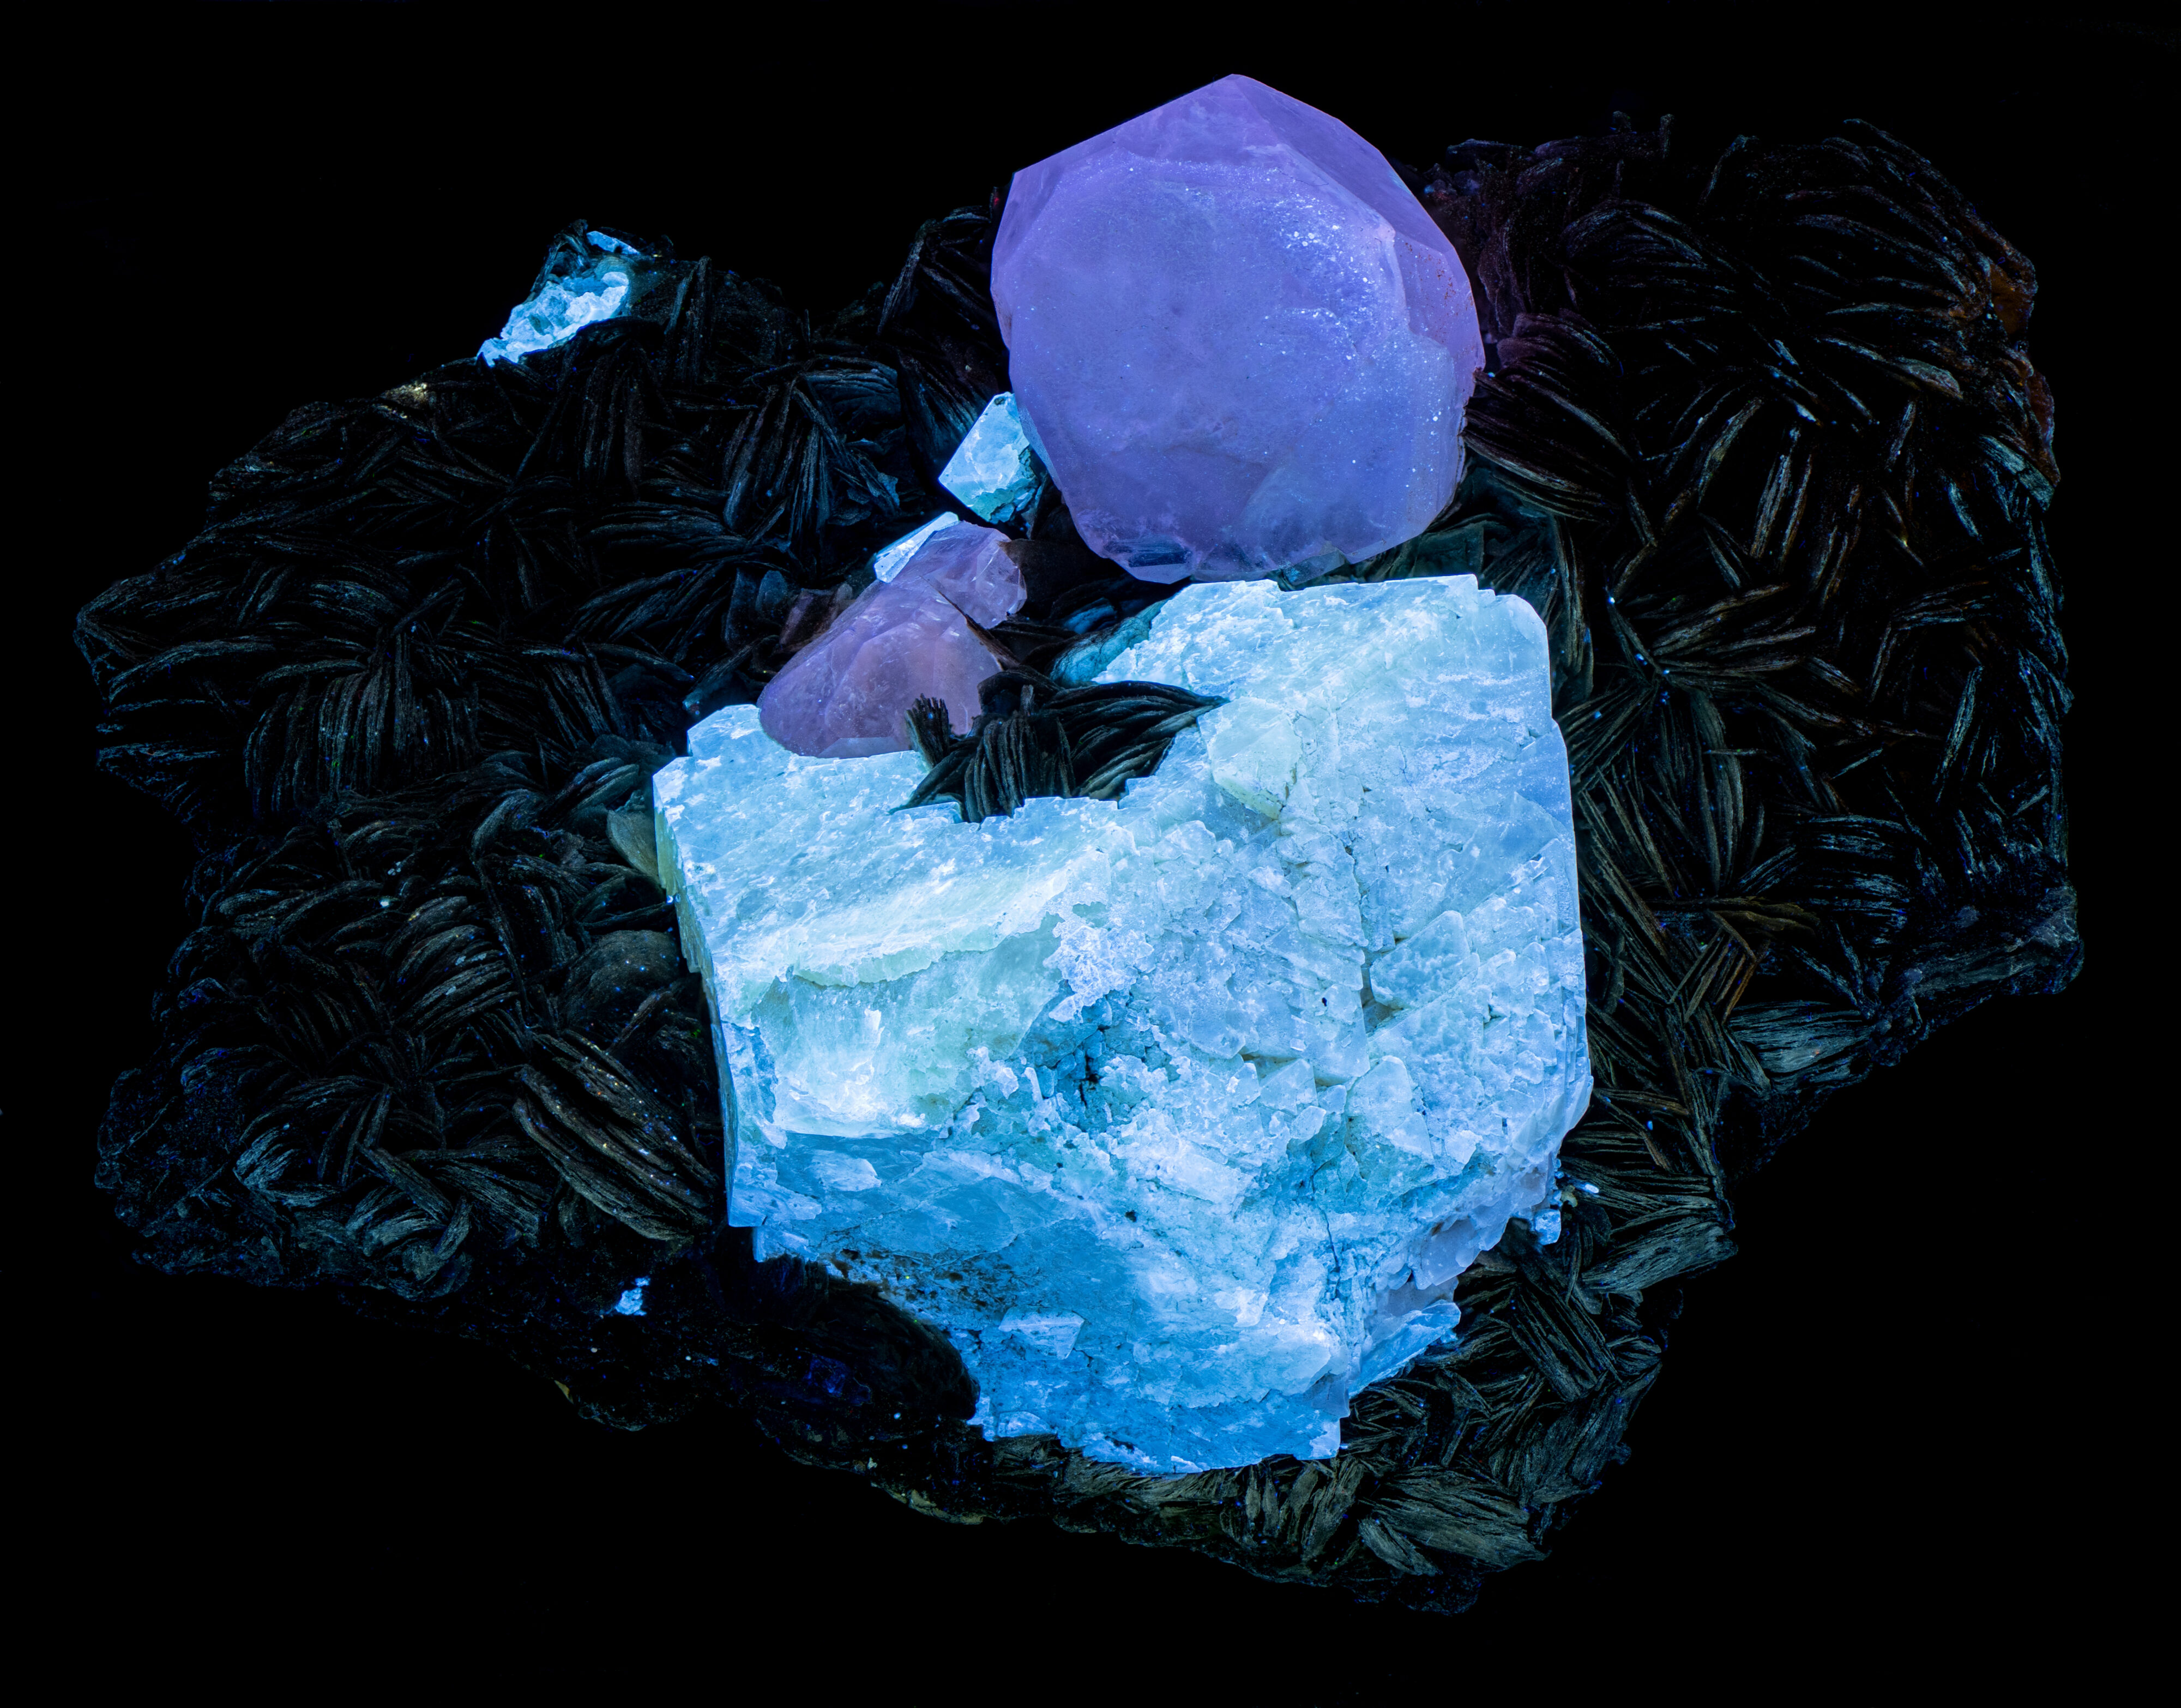
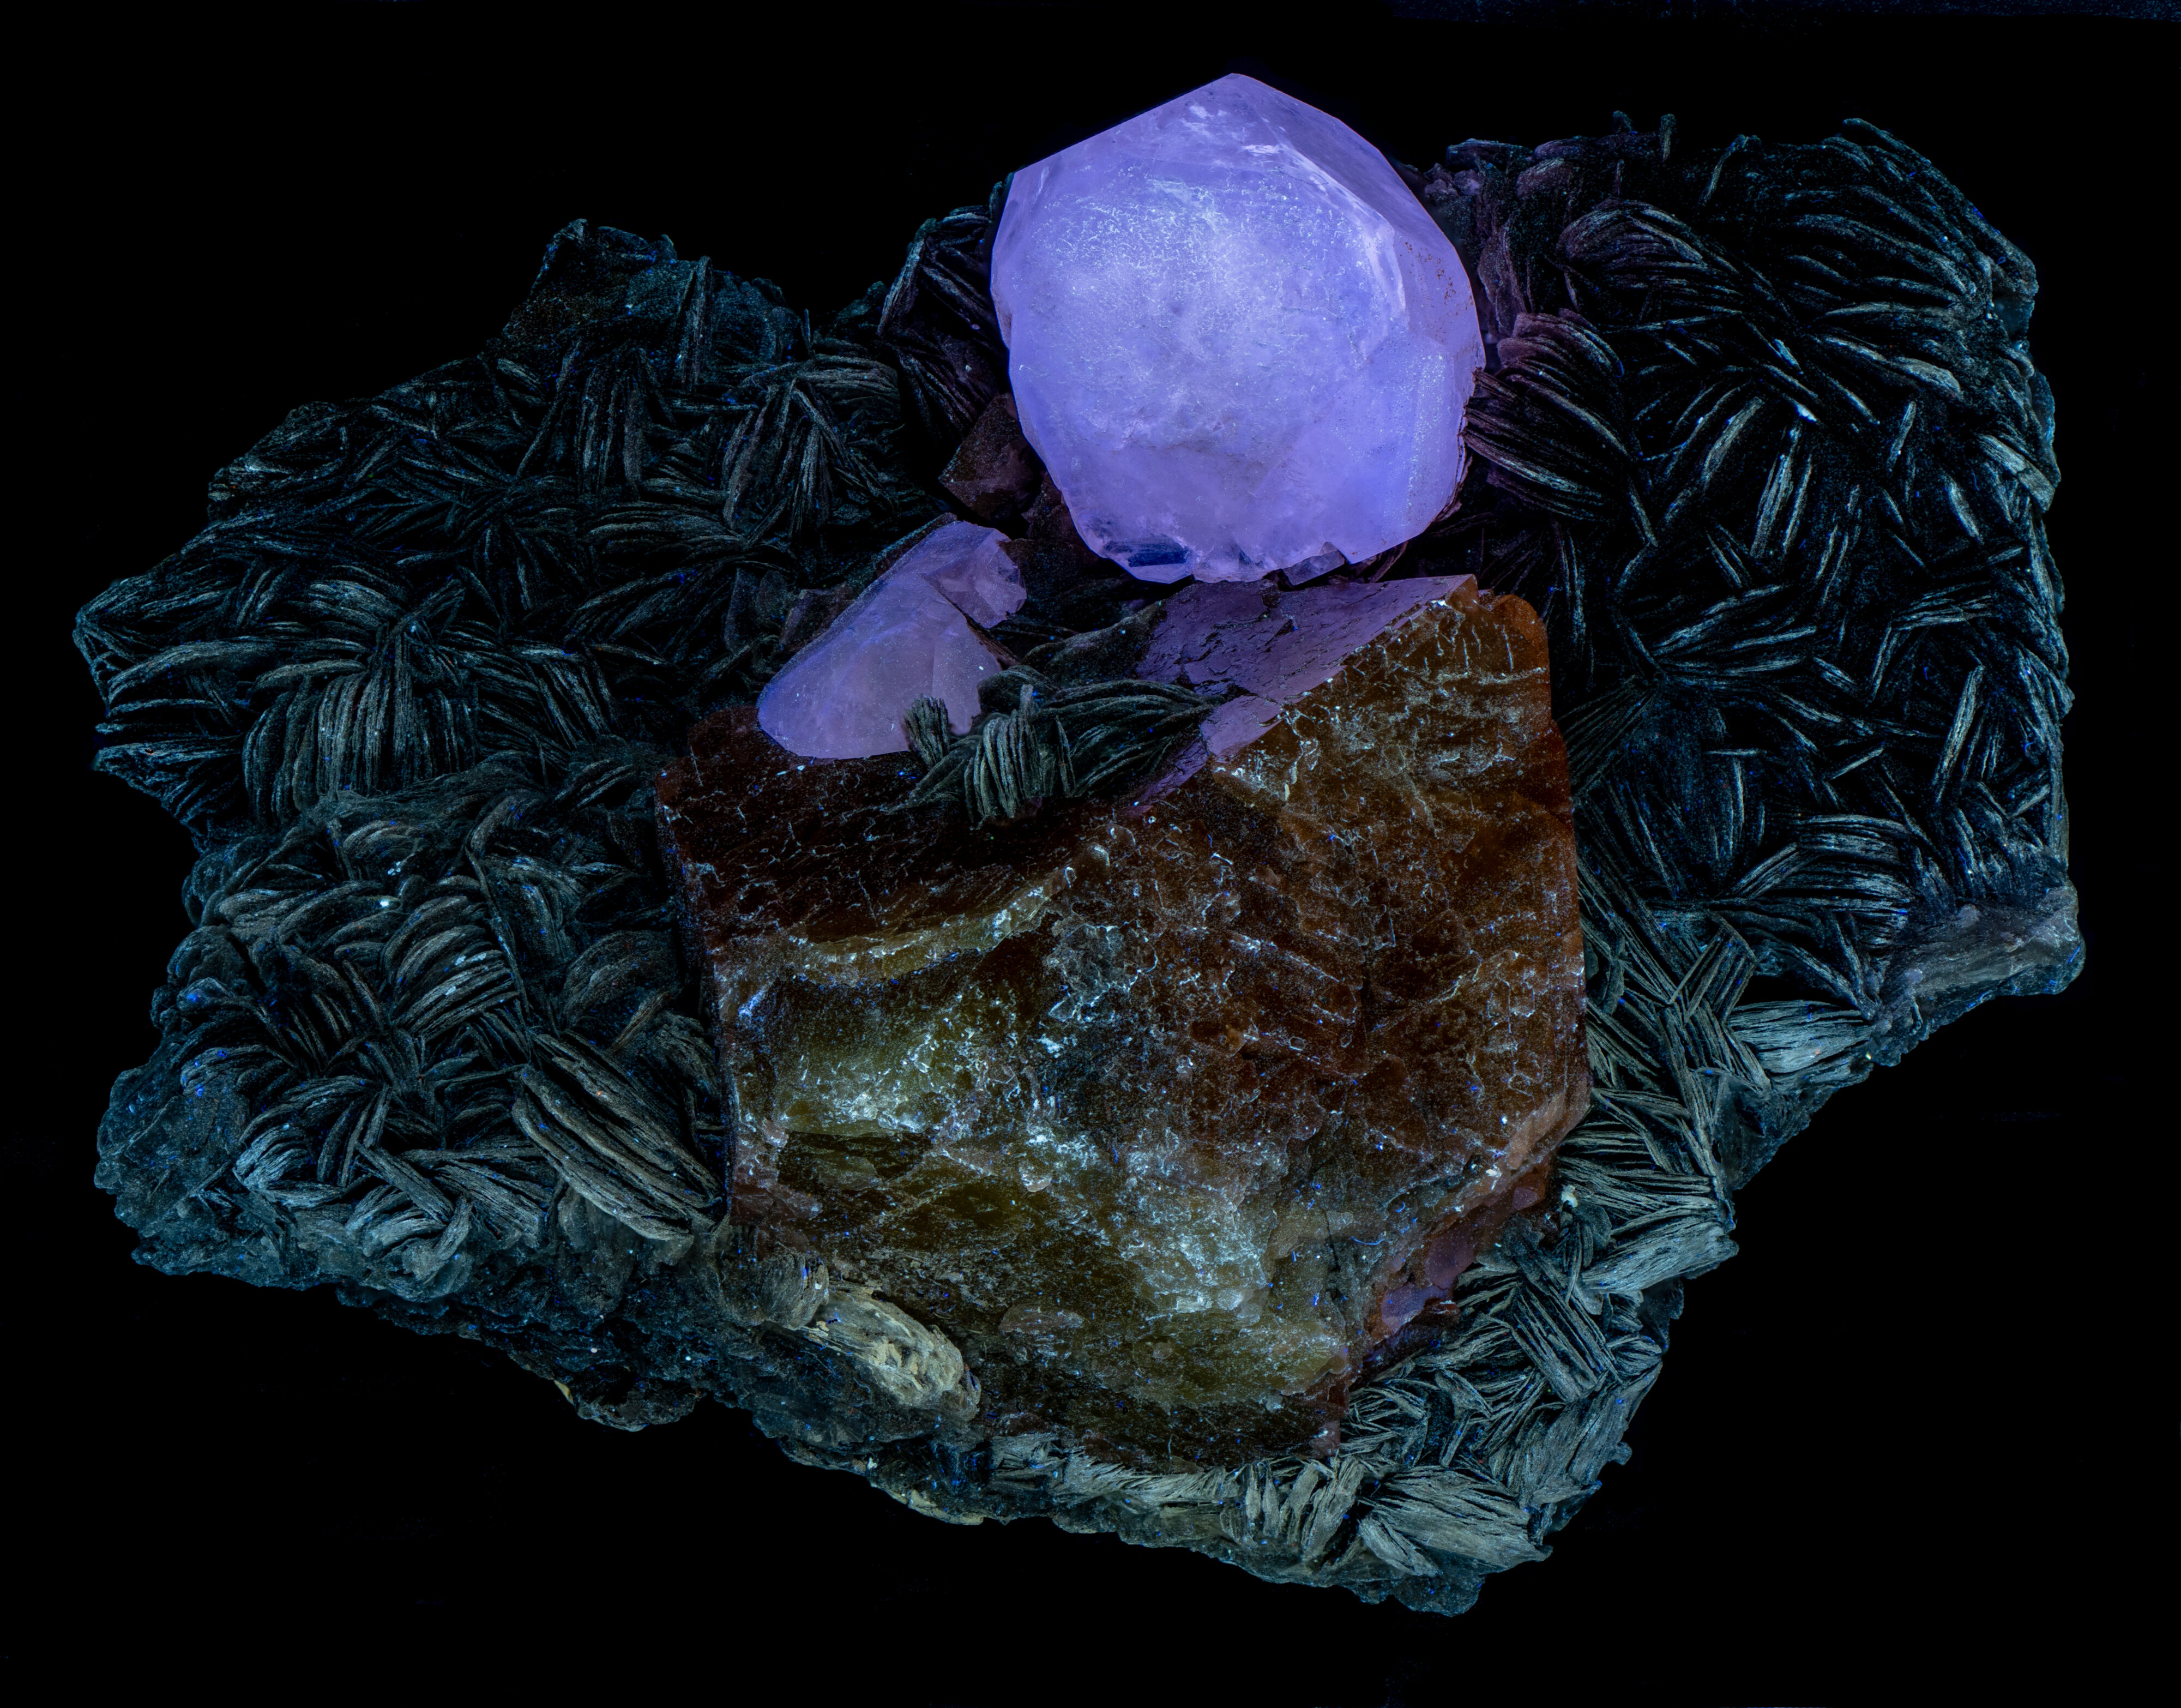
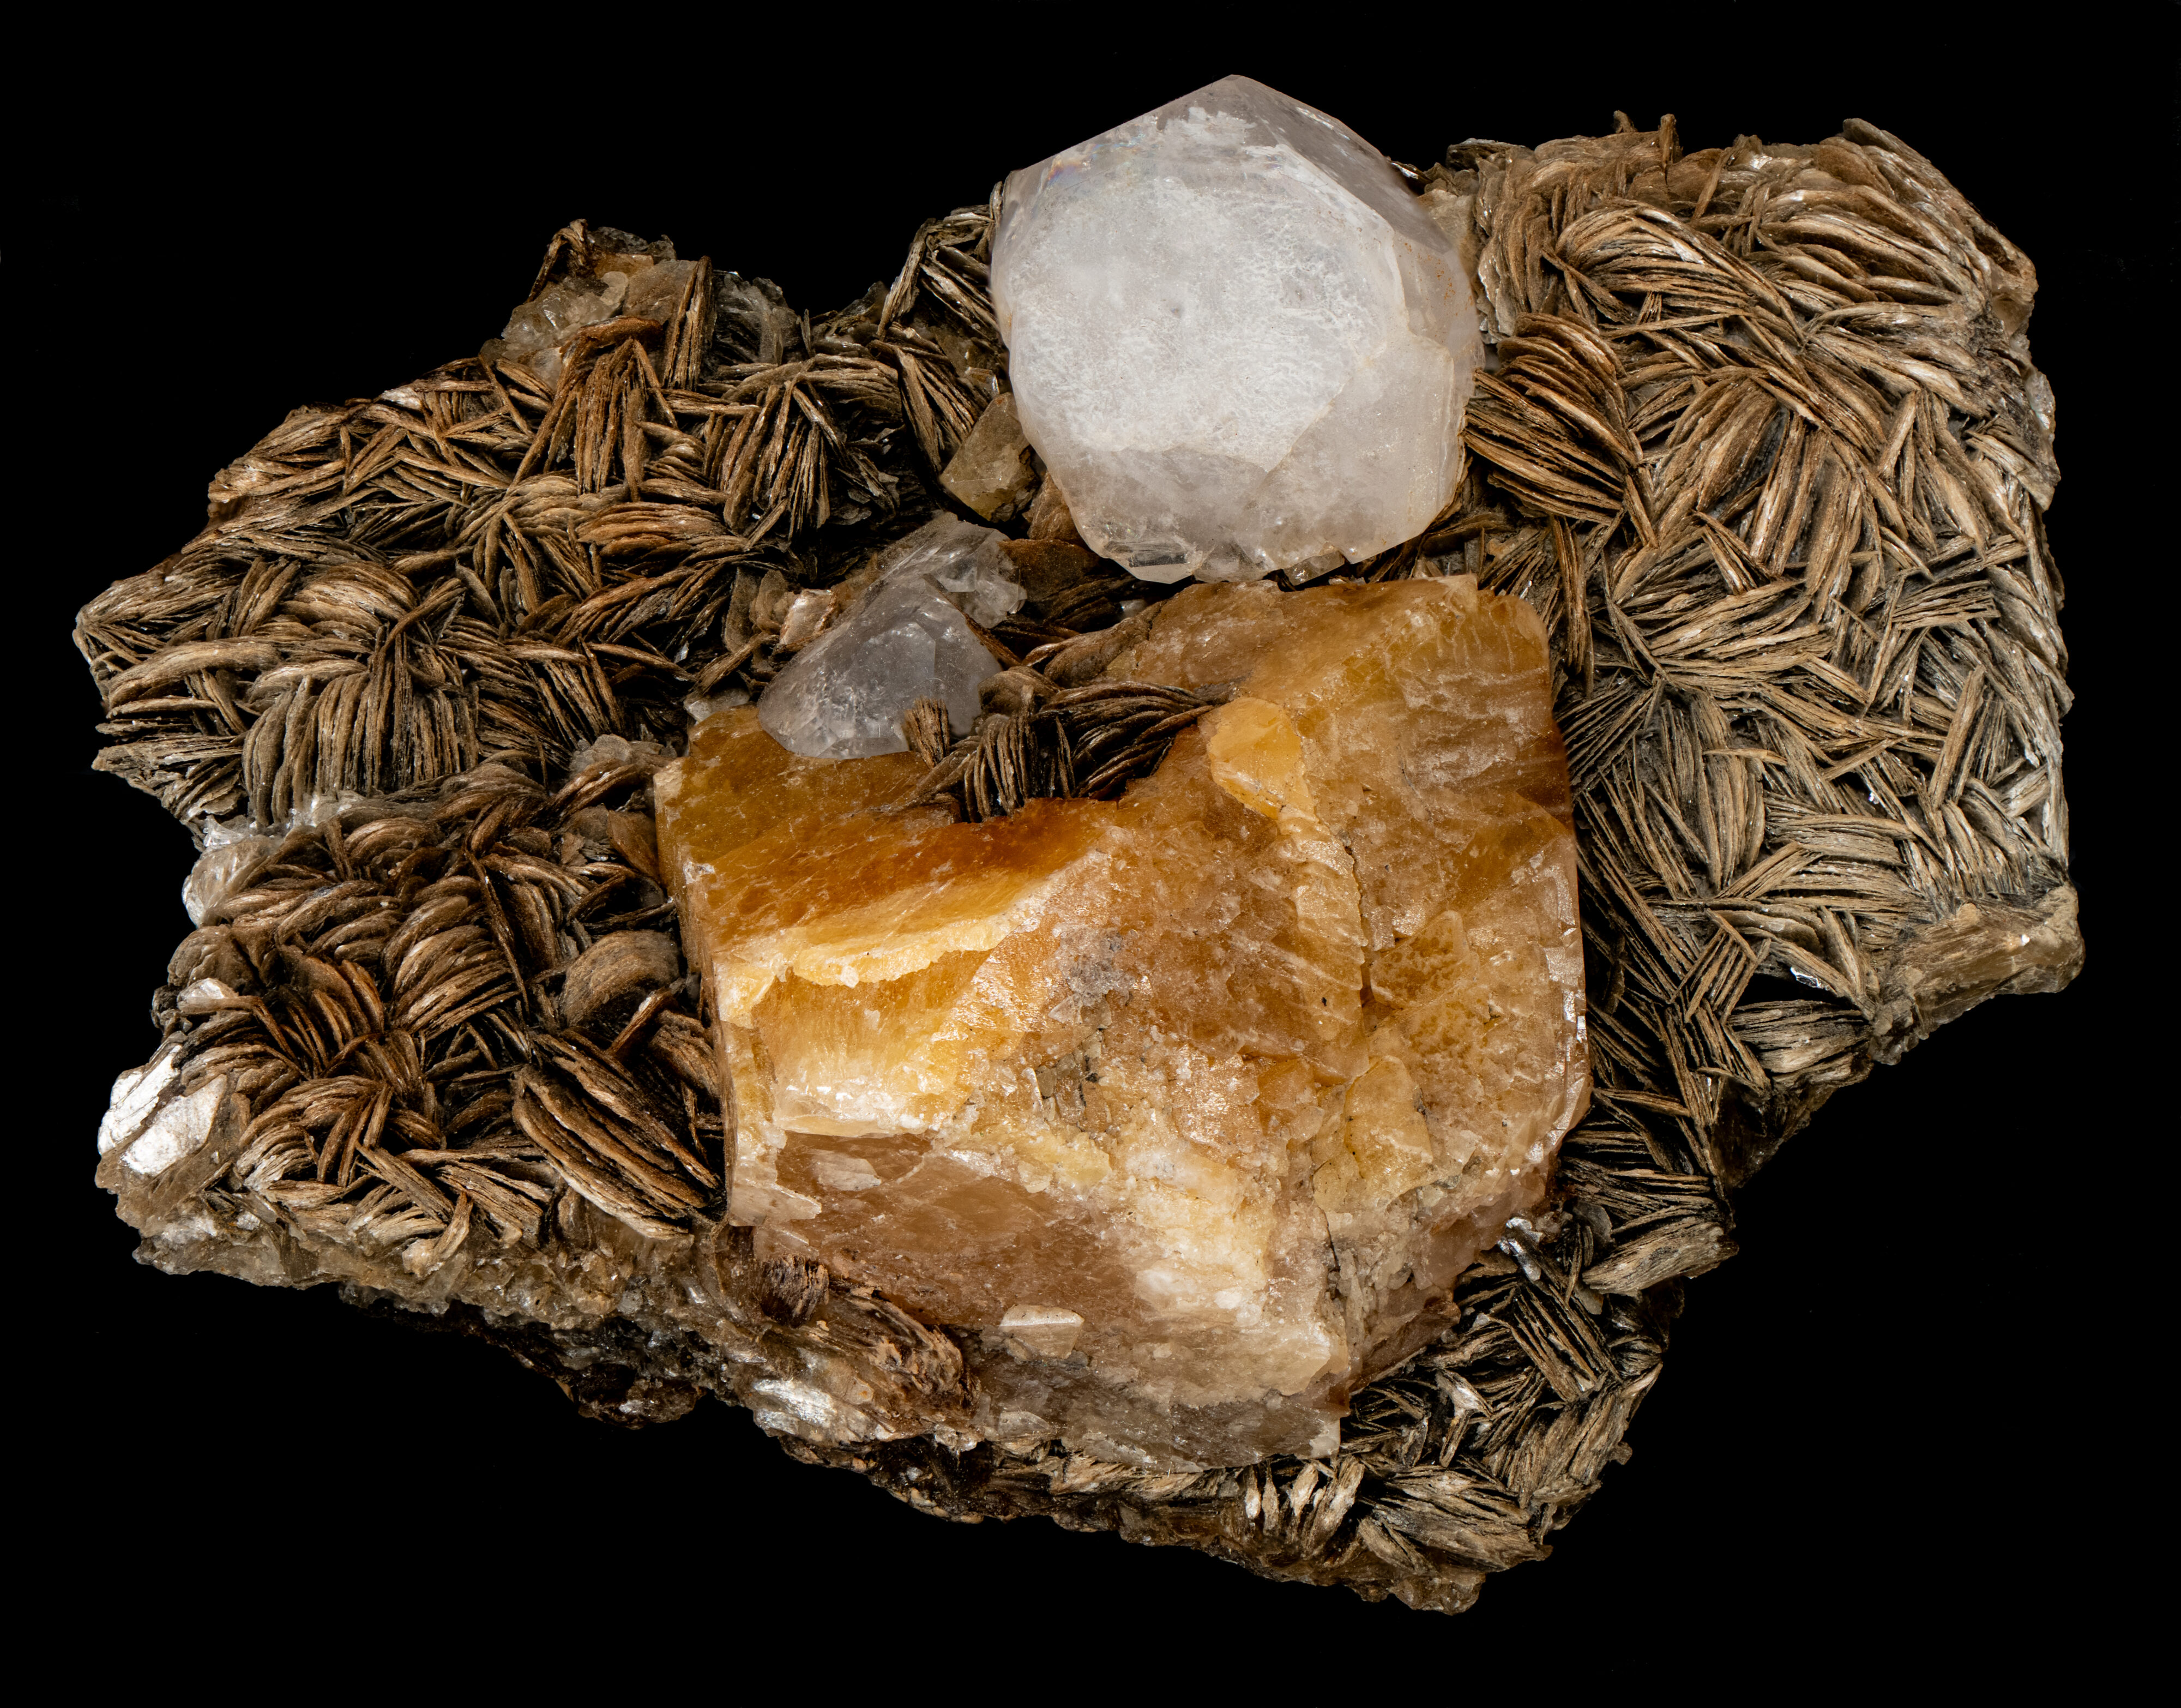
A tetragonal-pyramidal scheelite (Ca(WO4)) crystal and fluorapatite (Ca5(PO4)3F) crystals on a matrix of muscovite from Pingwu, Sichuan Province, China. Scheelite and fluorapatite is an uncommon association from Pingwu. Both minerals are fluorescent under all wavelengths of UV light. Their fluorescent colors change under the different wavelengths of illumination as shown in the table below.
Wavelength: 405 nm LW MW SW
Laser (365nm LED) (305nm LED) (257nm LED)
Scheelite Fluorescent Color: orange brown red light blue
Fluorapatite Fluorescent Color: yellow violet blue violet
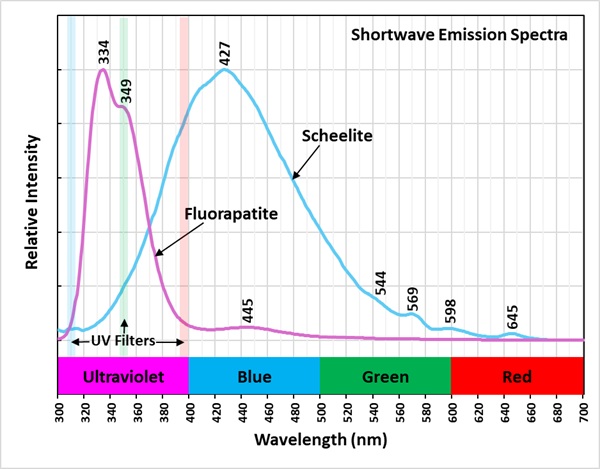
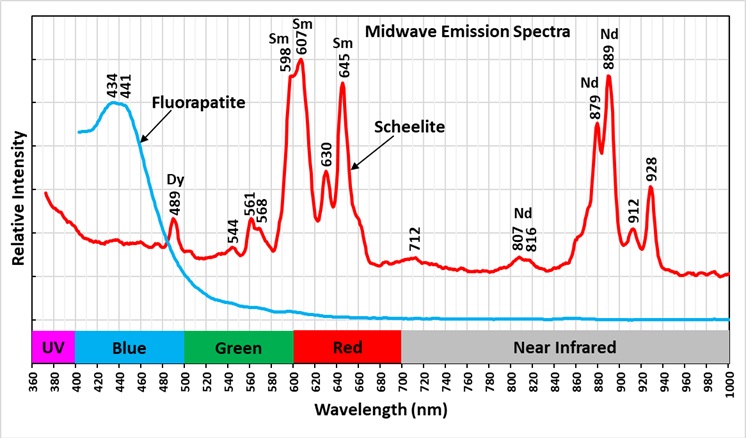
The shortwave, light blue fluorescence of scheelite is intrinsic. It is activated by the tungstate ion that is part of scheelite’s chemical composition. The shortwave emission spectrum of the light blue fluorescence is a broad peak with a peak at 427 nm that also extends into the ultraviolet region. The longwave and midwave fluorescence of scheelite is extrinsic. It is activated by rare earth element impurities that replace calcium. The longwave and midwave emission spectra contain many sharp peaks caused by the rare earth impurities. The red midwave fluorescence is mainly caused by samarium (Sm3+) that produces several sharp peaks (598 nm, 607 nm, and 645 nm). There is another set of sharp peaks in the near infrared (879 nm and 889 nm) that are activated by neodymium (Nd3+). There are more peaks in the midwave spectrum that are unassigned to a specific rare earth element. Some of the sharp peaks of the midwave spectrum are also present in the shortwave emission spectrum, but their shortwave intensity is considerably reduced in comparison to the bright light blue fluorescence activated by the tungstate ion.
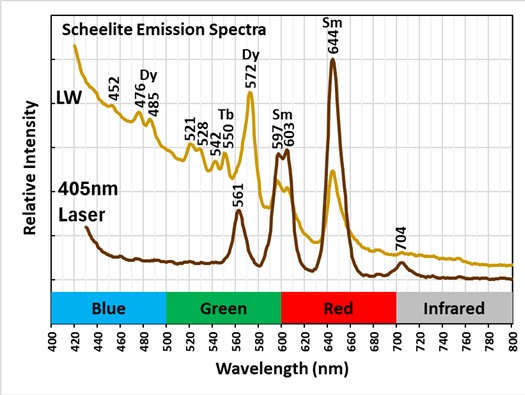
Scheelite’s longwave fluorescence is dim, but there is enough brightness to measure an emission spectrum. The spectrum shows sharp peaks activated by samarium (Sm3+) and there are also peaks activated by dysprosium (Dy3+) that combine with the red samarium fluorescence to produce the brown fluorescent color.
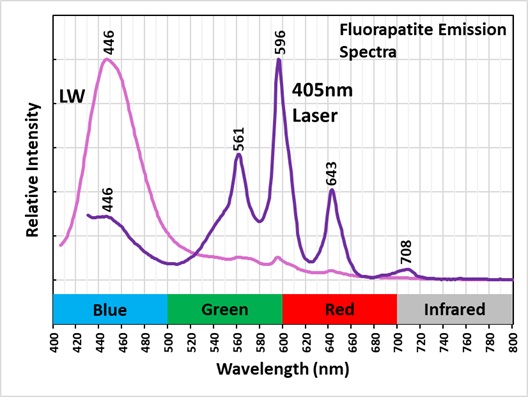
The fluorescence of the fluorapatite is also extrinsic and is also activated by rare earth element impurities replacing calcium. The longwave emission spectrum of the fluorapatite crystal has an asymmetric peak with a maximum at 446 nm and possibly a secondary peak around 454 nm. The midwave emission spectrum has a flattop peak of two close peaks at 434 nm and 441 nm. The biggest longwave and midwave peaks are likely caused by europium (Eu3+). The longwave spectrum also has much smaller peaks at 561 nm, 596 nm, and 643 nm. These peaks are much more prominent than in the spectrum illuminated by a 405 nm laser. These peaks are likely activated by dysprosium and possibly samarium. The 405 nm laser makes the fluorapatite crystal fluoresce yellow. The shortwave emission spectrum of fluorapatite shows very bright ultraviolet fluorescence. The spectrum has a double peak at 334 nm and 349 nm. The ultraviolet fluorescence is activated by cerium (Ce3+).
In the false color image of the ultraviolet fluorescence, the fluorapatite appears green and the scheelite appears orange red due to the visible fluorescence extending into the ultraviolet region. The false color image is a composite of narrow bandpass images at 394 nm, 350 nm and 310 nm. The location of the bandpass filters used to take the images used for the false color image are shown in the shortwave emission spectral plot.


Summary of luminescence responses:
Scheelite (Mindat) (RRUFF)
- Fluorescence under Longwave (365nm LED) UV light: Orange
- Fluorescence under Midwave (305nm LED) UV light: Red
- Fluorescence under Shortwave (255nm LED) UV light: Blue
- Fluorescence under Longwave (365nm LED) UV light: Violet
- Fluorescence under Midwave (305nm LED) UV light: Blue
- Fluorescence under Shortwave (255nm LED) UV light: Violet