Two Feldspars from Hurricane Mountain, Carroll County, New Hampshire
Contributed by: Michael Crawford
Date: Jul 31st, 2025
Locality: Hurricane Mountain localities, North Conway, Conway, Carroll County, New Hampshire, USA (See on Mindat)
Size: 8 x 10 cm
Description:
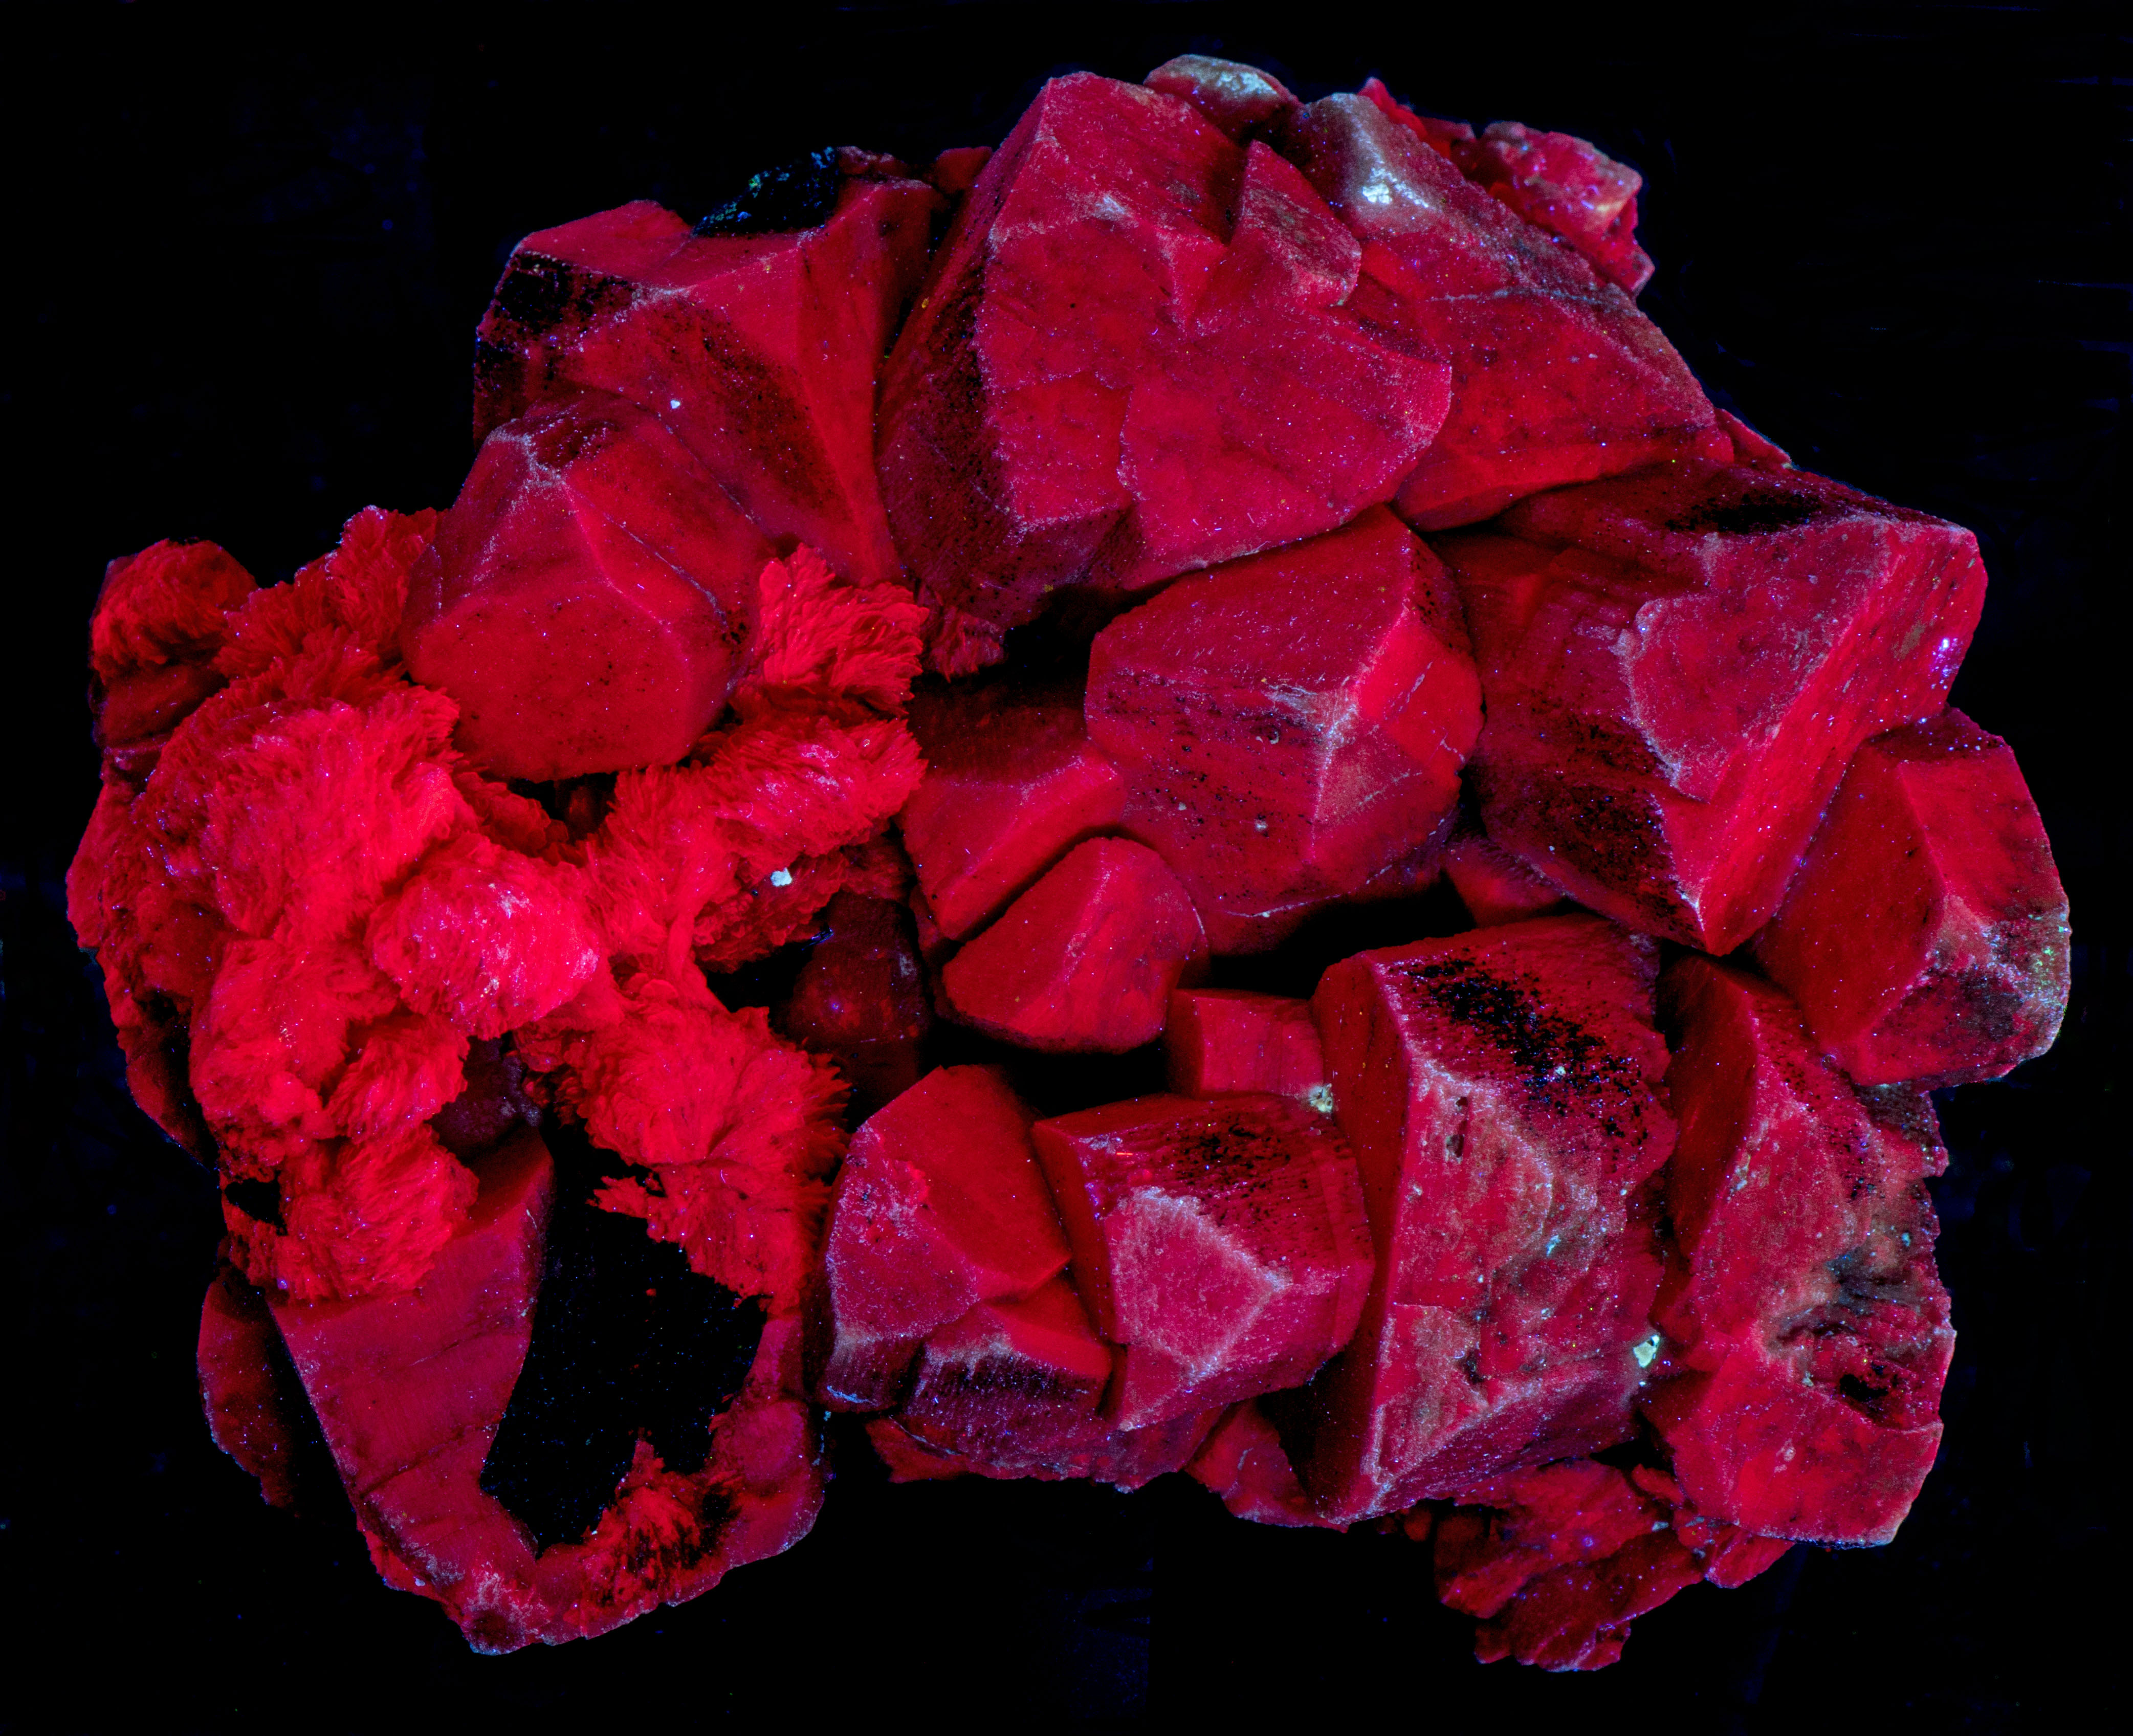
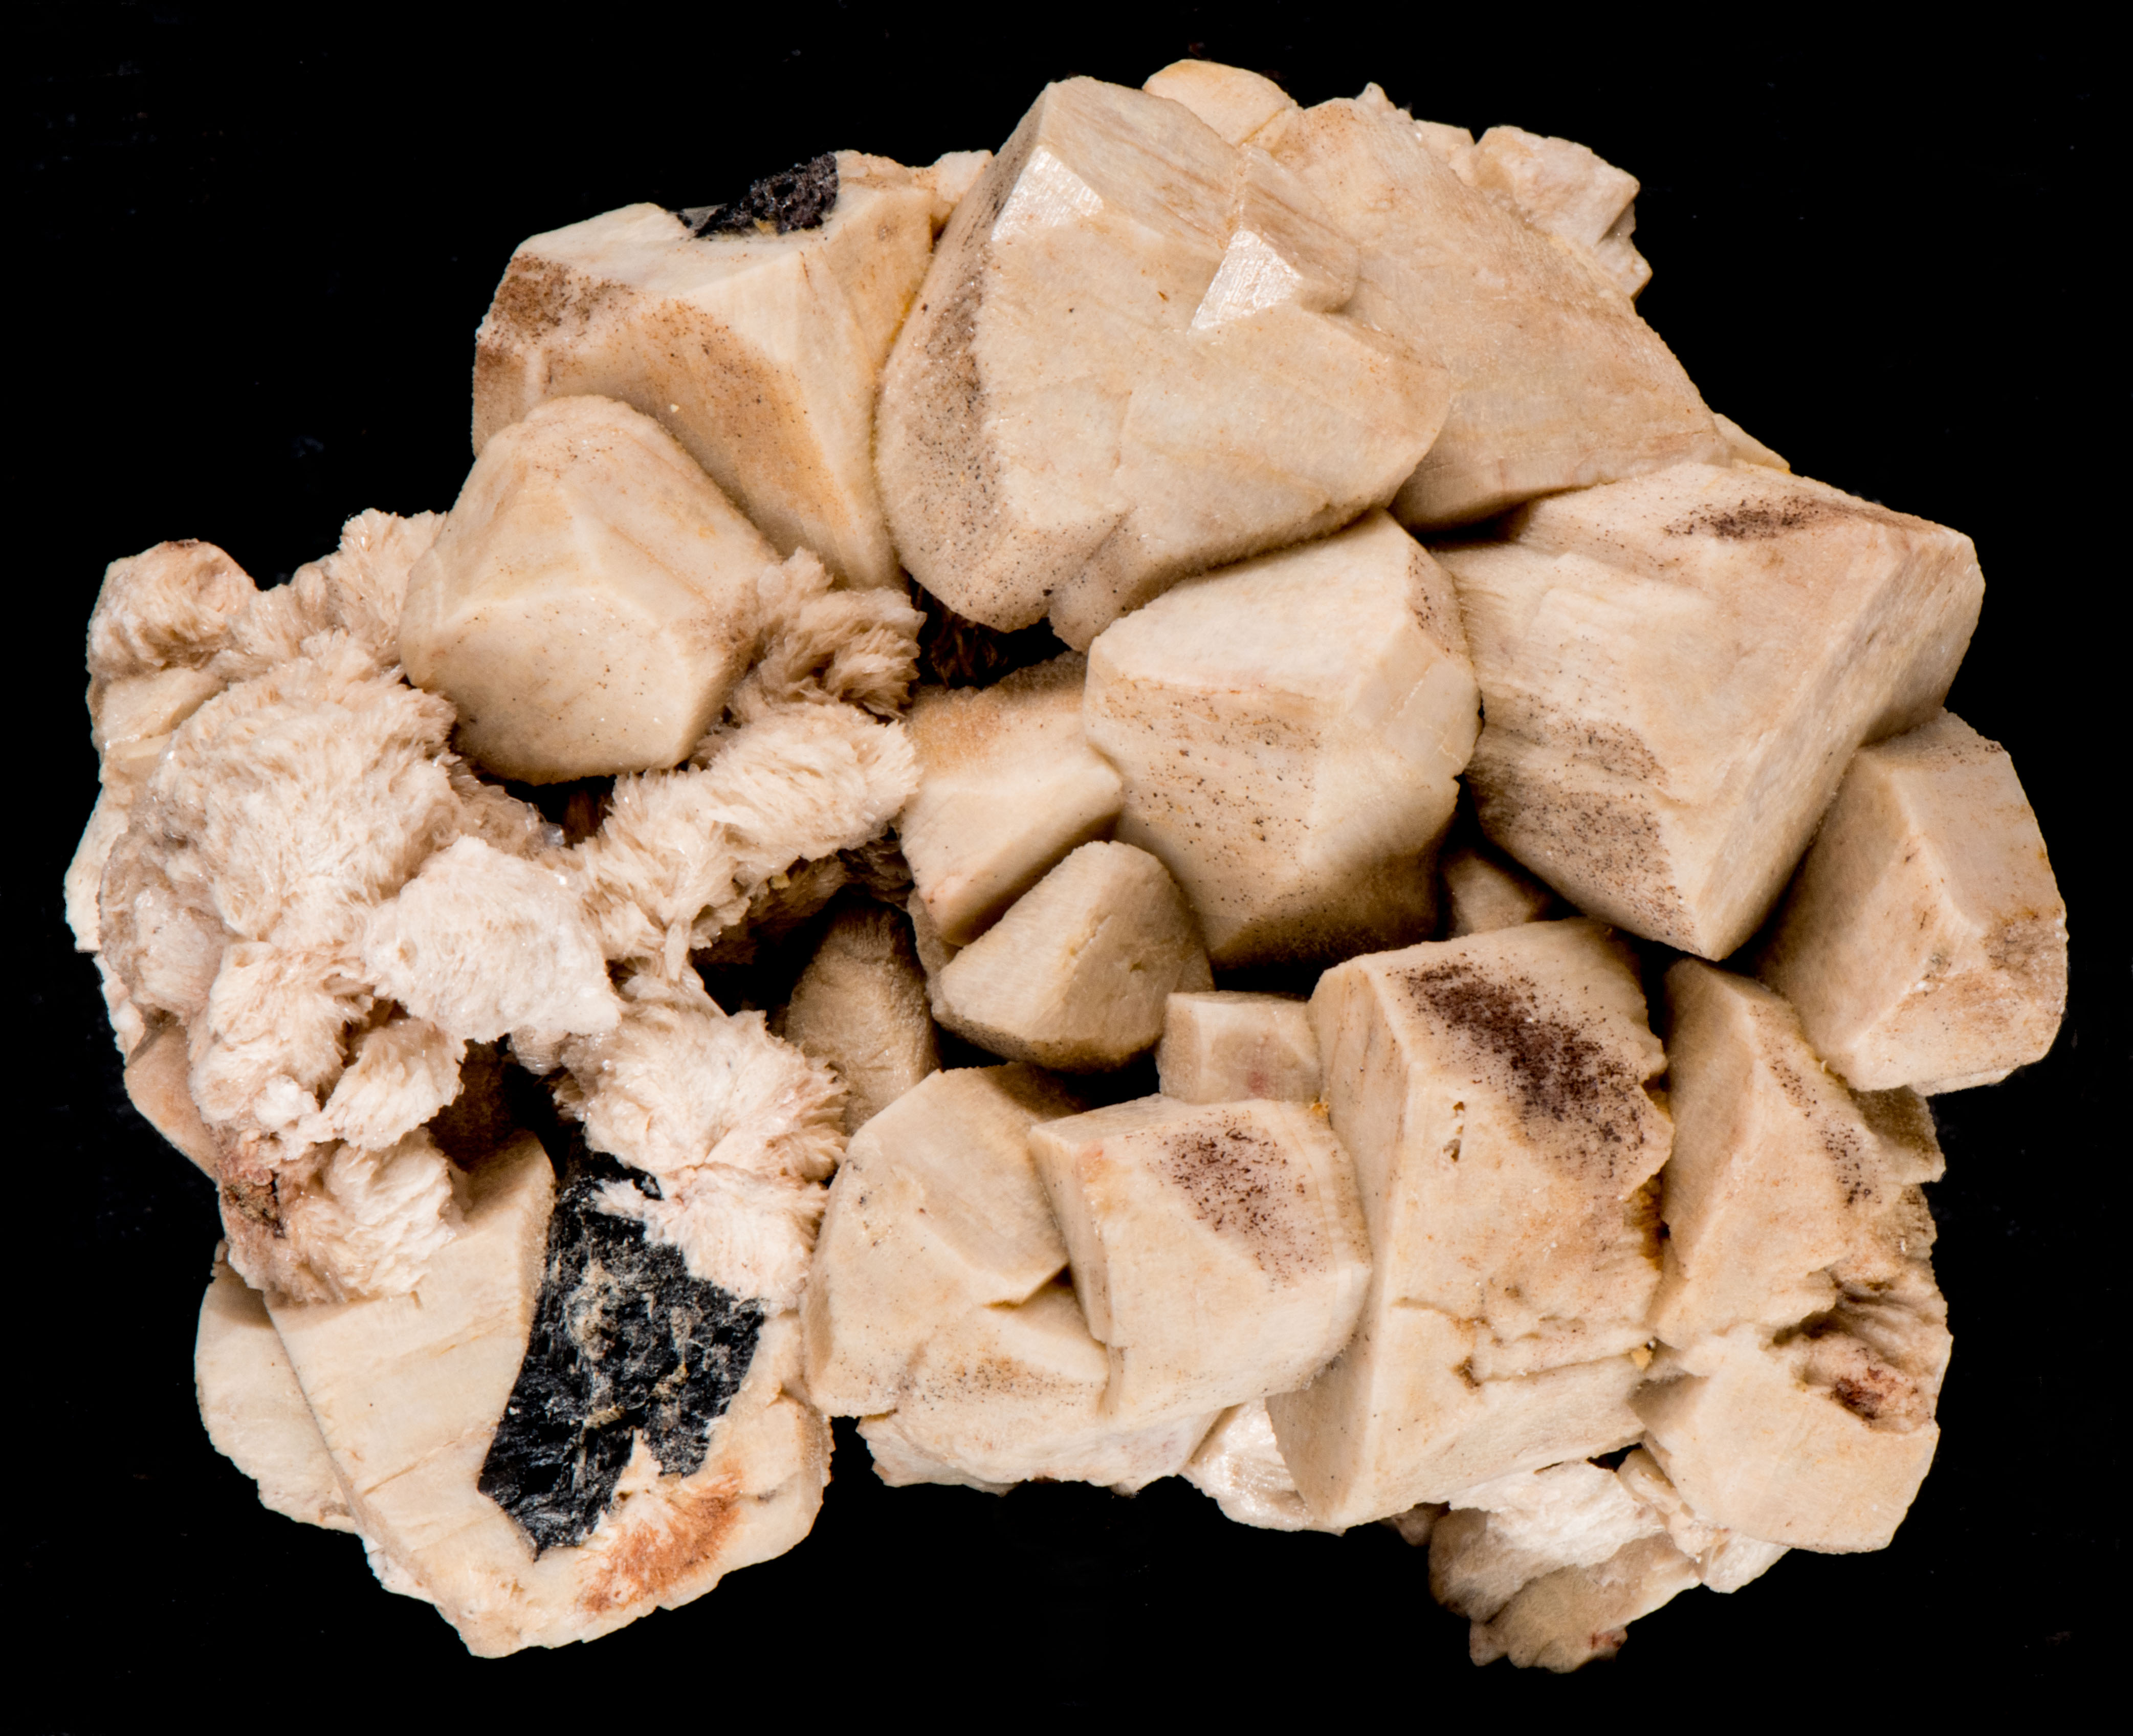
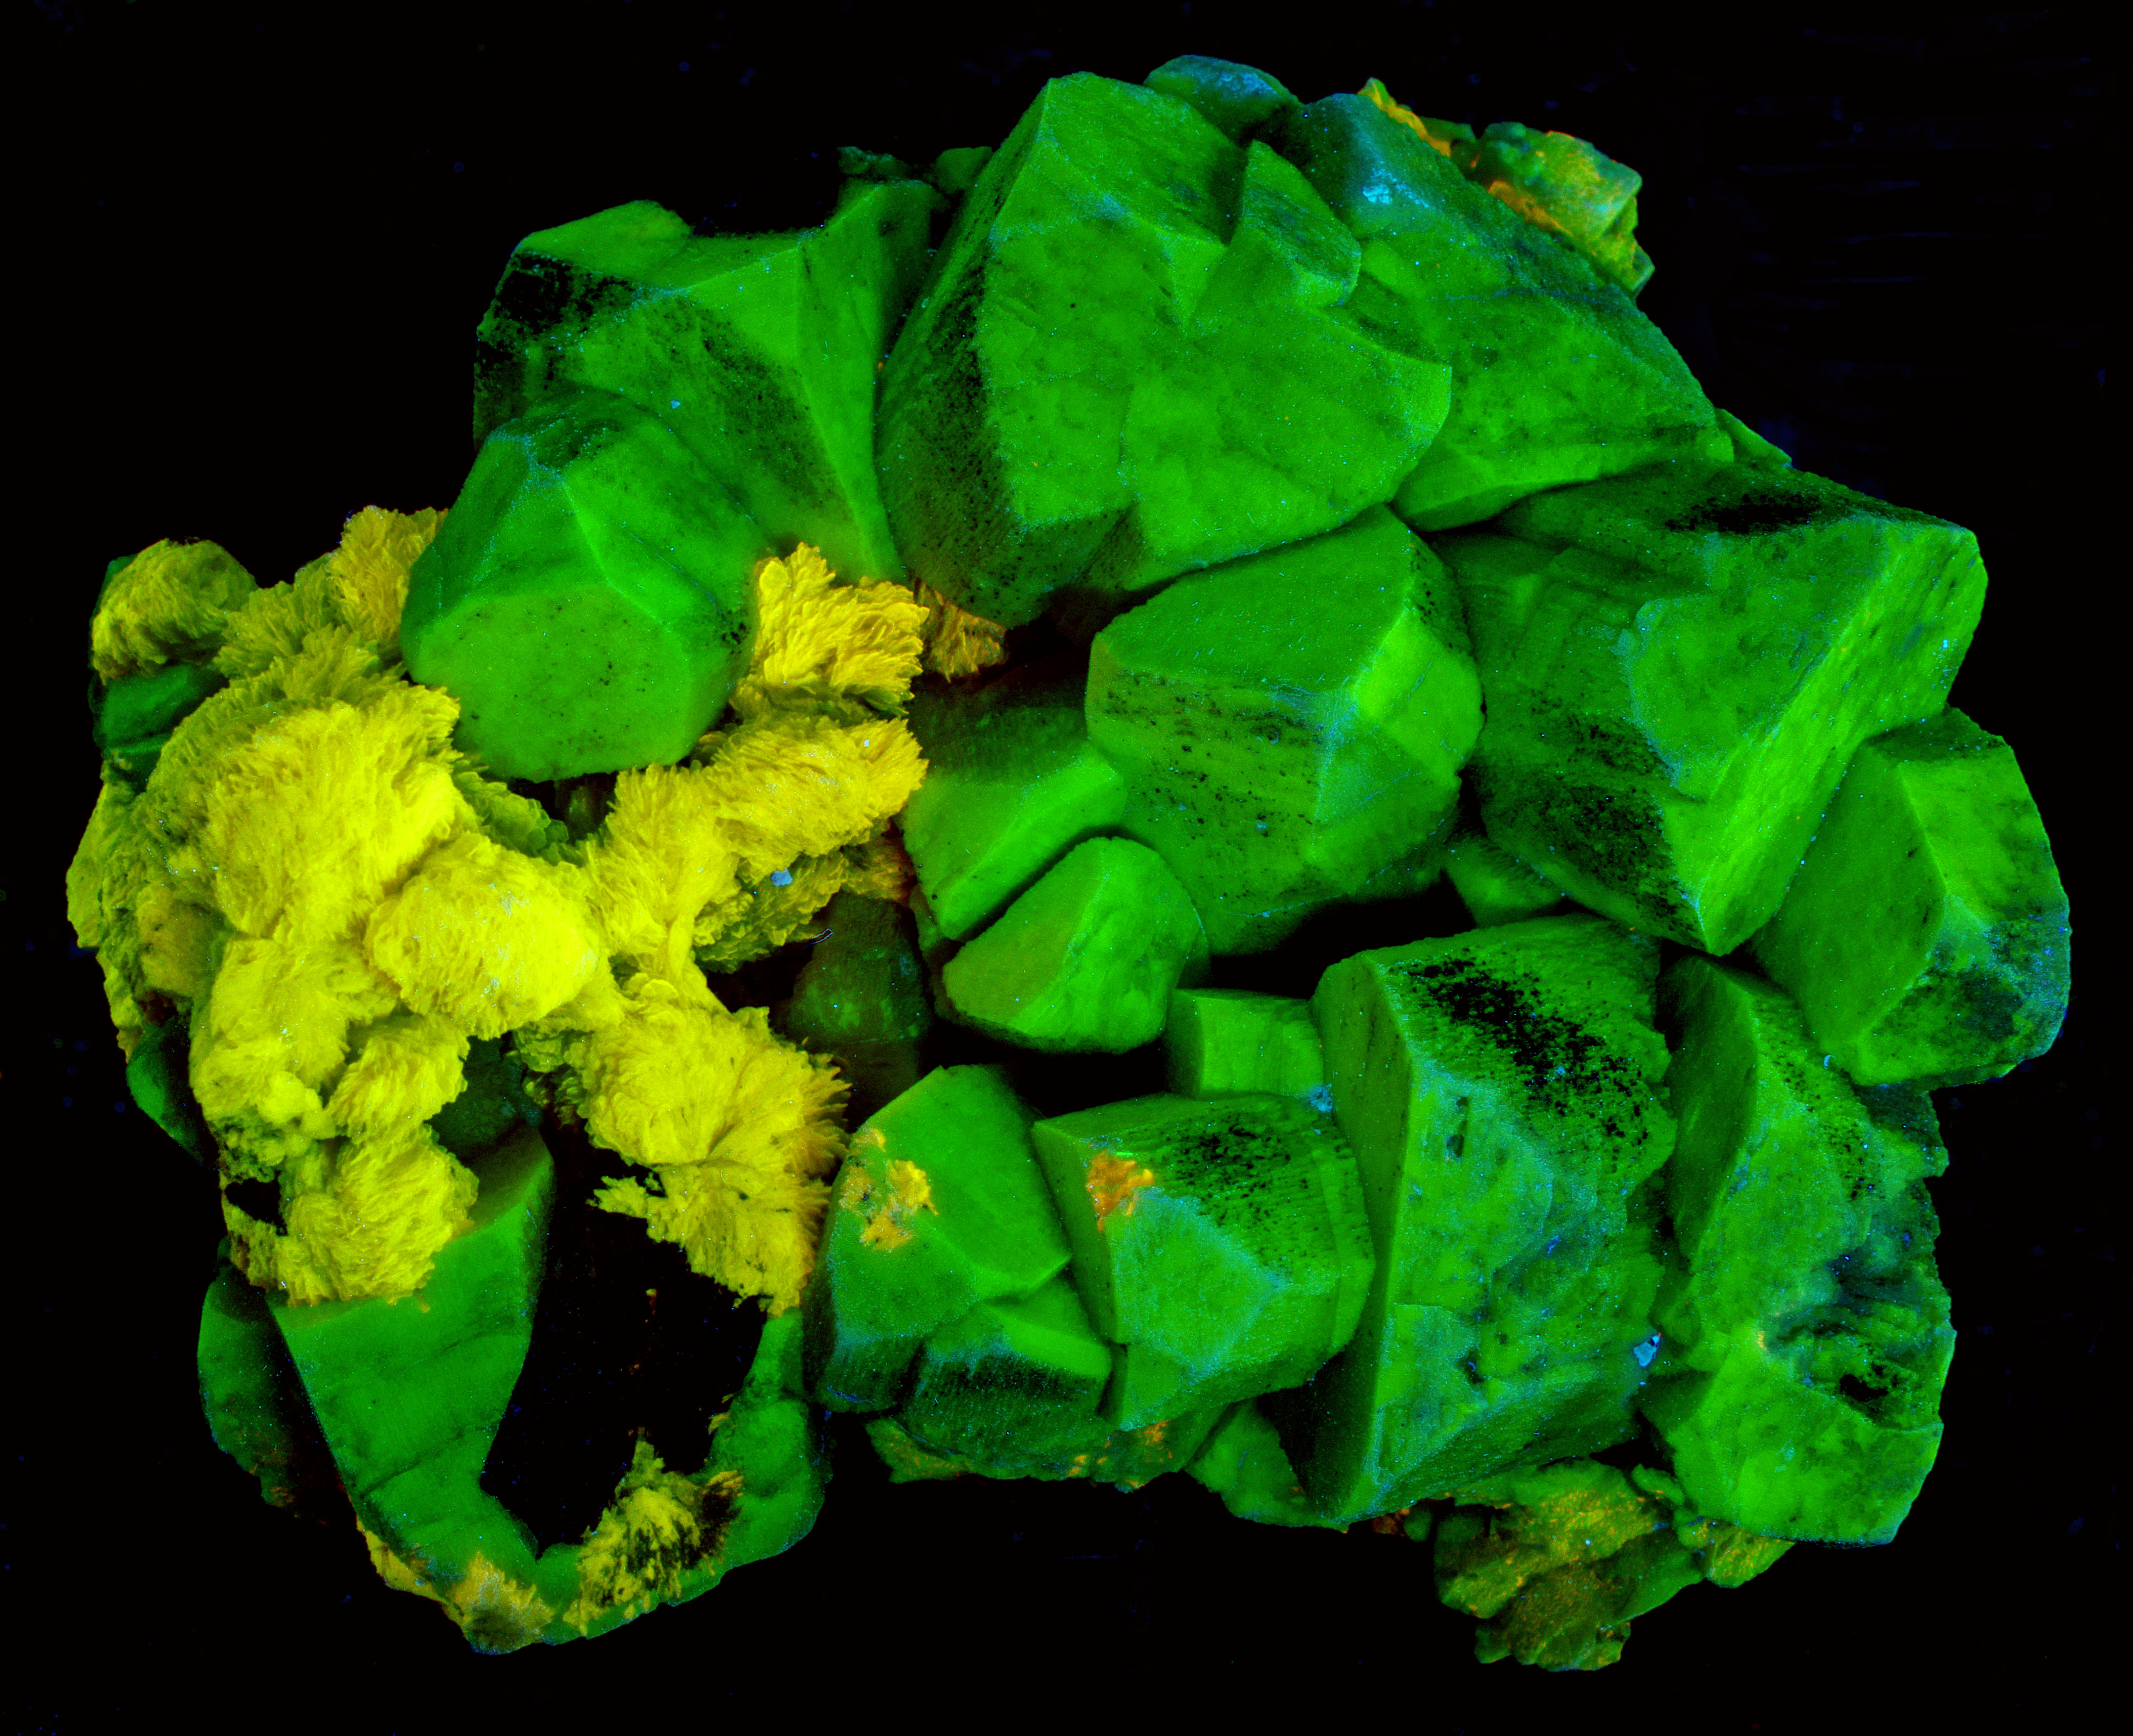
This specimen has two generations of feldspar from Hurricane Mountain, North Conway, Carroll County, New Hampshire that fluoresce red under shortwave UV illumination. The specimen is from an alkali syenite pegmatite. Large microcline (K(AlSi3O8)) crystals were the first generation. Small sheeves of albite (Na(AlSi3O8)) form on top of the microcline. Non-fluorescent black arfvedsonite are also present.
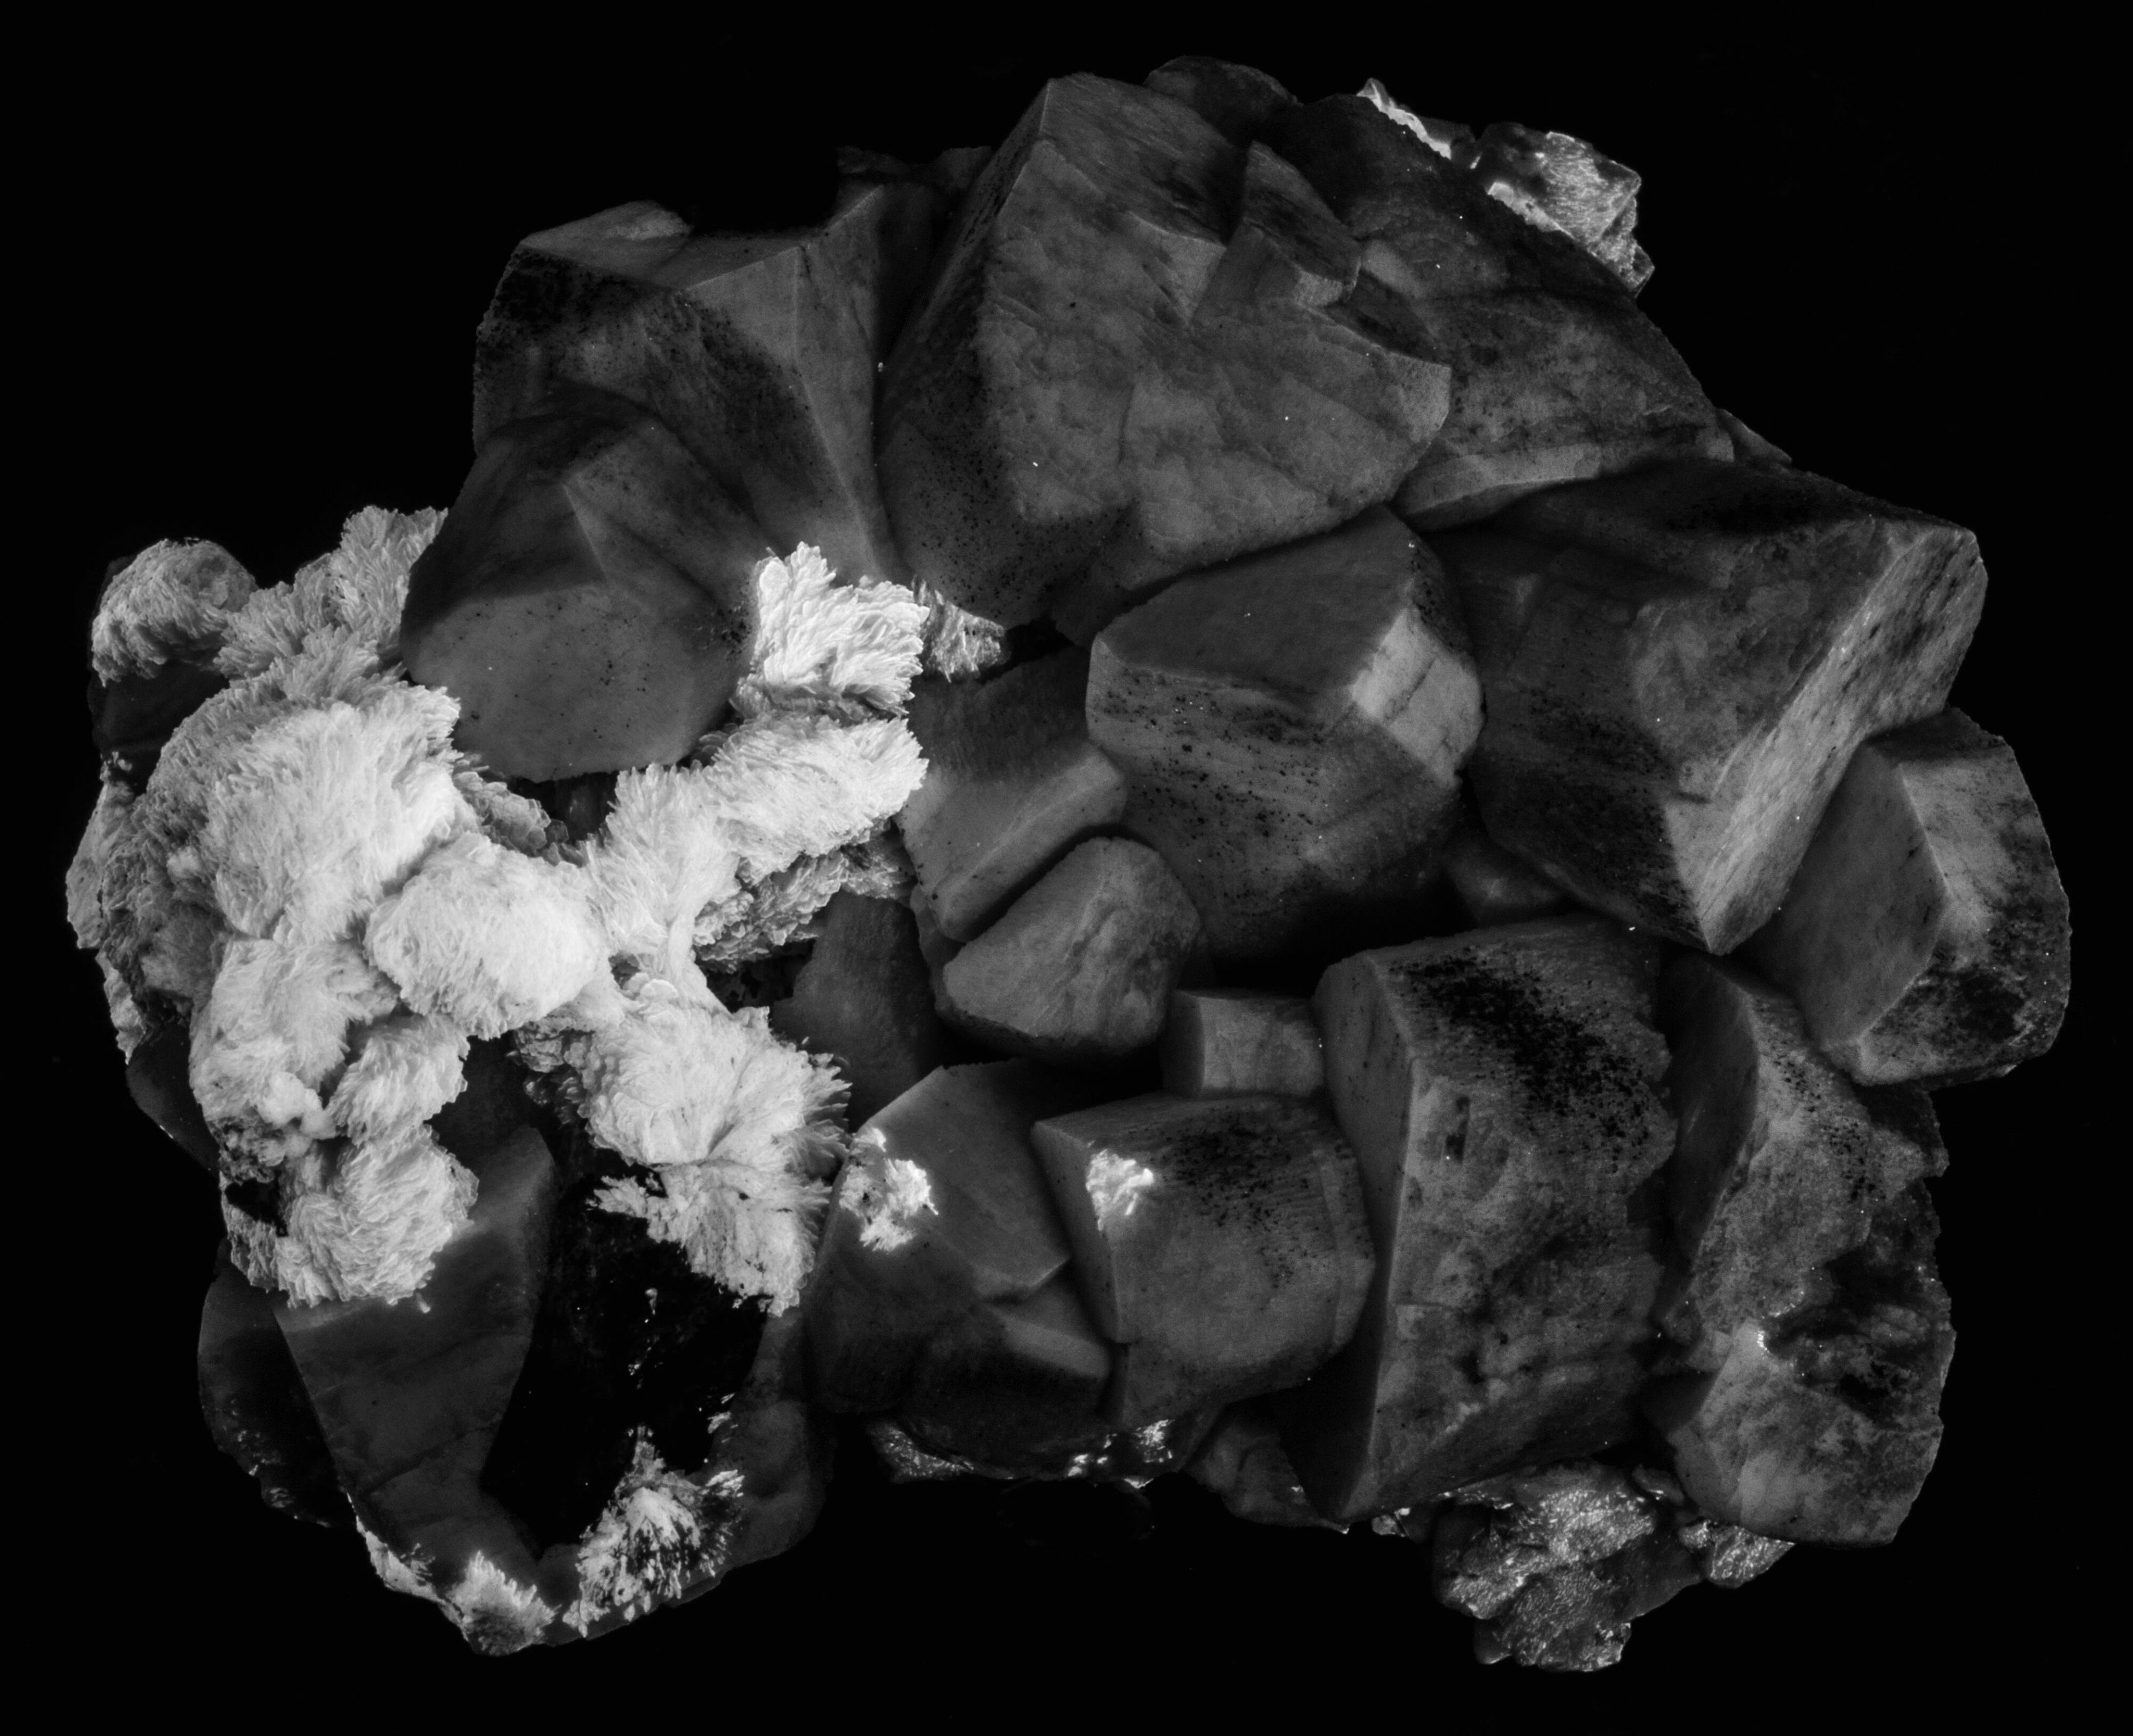
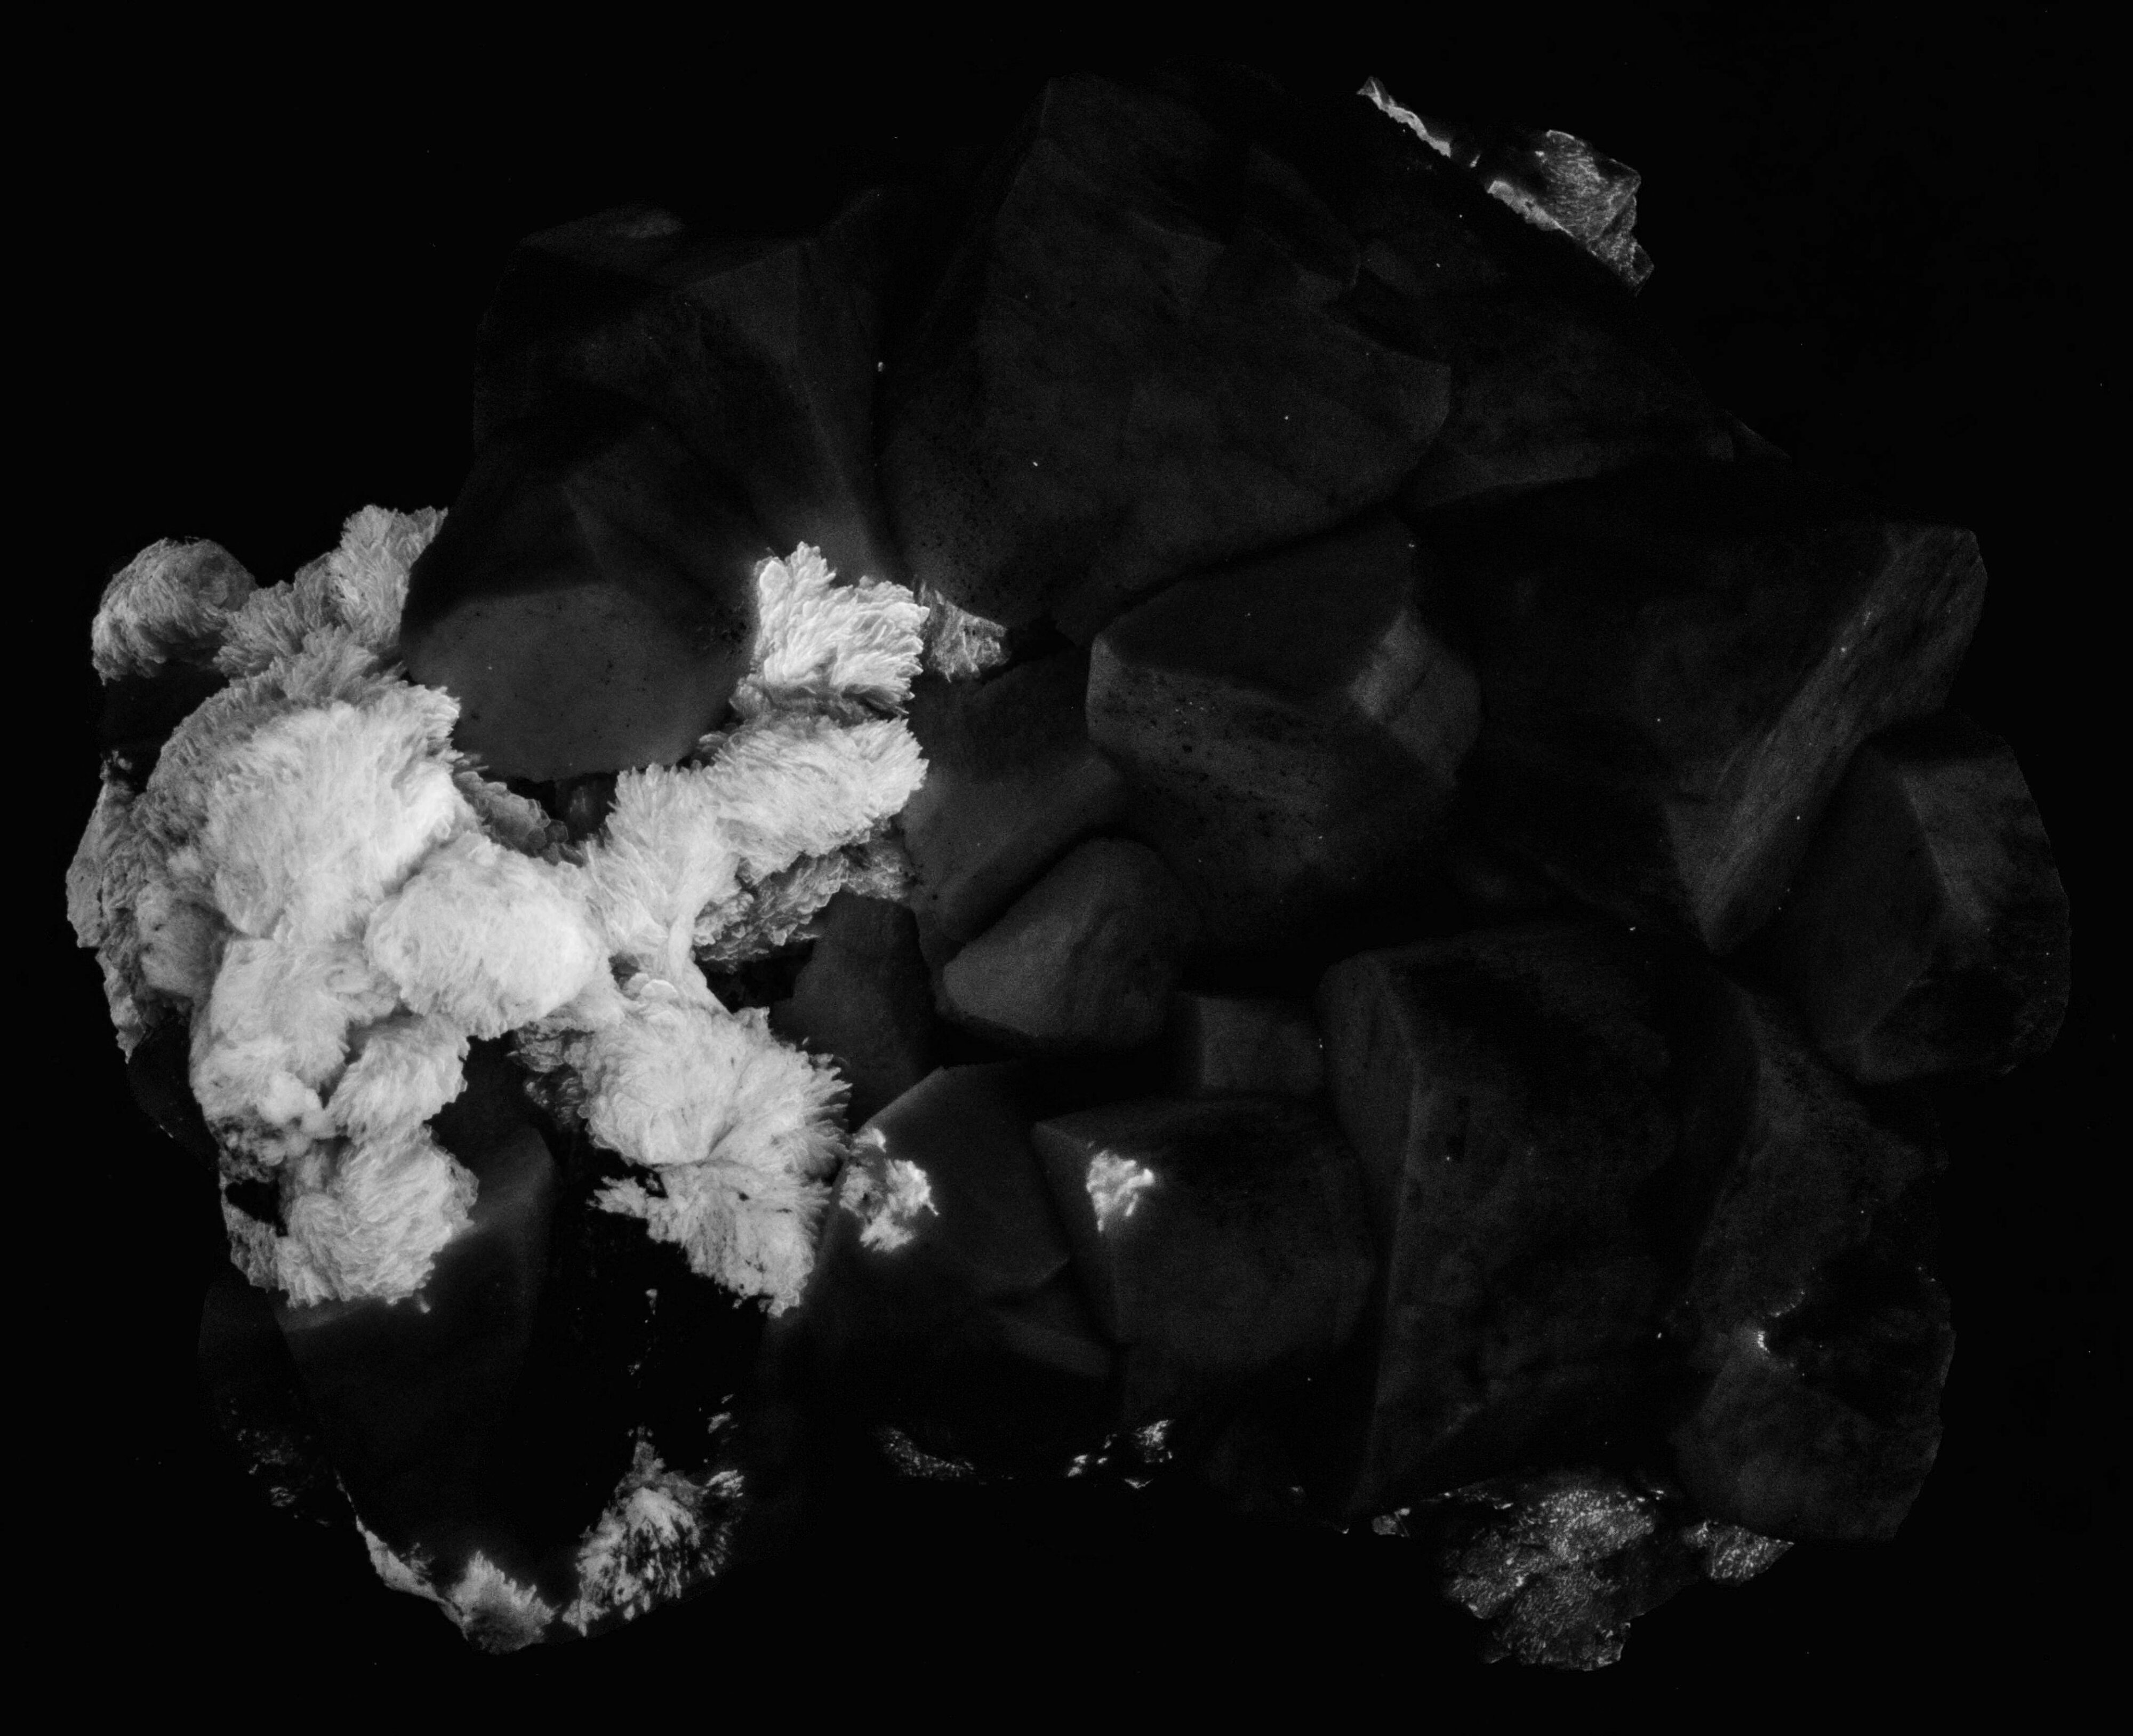
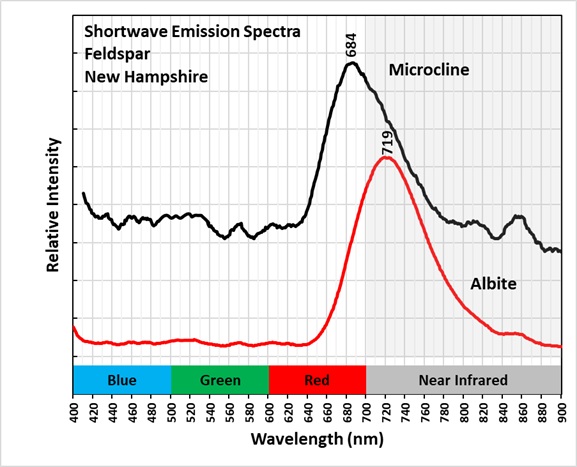
The two feldspars can be distinguished by their different crystal habits and a slight difference in the shade of red in the image of shortwave fluorescence. The red fluorescence in both feldspars is activated by ferric iron (Fe3+) replacing aluminum (Al3+). The shortwave emission spectra are different for the two feldspars. Microcline emission peaks at 684 nm and albite peaks in the near infrared at 719 nm. This difference can be seen in images of the near infrared fluorescence. The image taken with a 720 nm bandpass filter shows that the albite fluorescence is much brighter at this wavelength. The image taken with an 850 nm cutoff filter shows greater contrast between the albite and microcline. At this longer wavelength, only the albite is still fluorescent.
The color infrared image is composed of green and red visible bands and a near infrared band. The 850 nm cutoff image was used for the near infrared because it has the greatest contrast for discriminating the feldspars. The microcline image appears green and albite appears yellow.
Summary of luminescence responses:
Albite (Mindat) (RRUFF)
- Fluorescence under Shortwave (255nm LED) UV light: Red
- Fluorescence under Shortwave (255nm LED) UV light: Red
- Fluorescence under Longwave (365nm LED) UV light: Blue